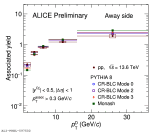
| Away-side yield comparison between measured Ds-h and PYTHIA8 predictions ($p_{T}^{assoc}$ > 0.3 GeV/c)
|
|
| Away-side width comparison between measured Ds-h and PYTHIA8 predictions ($p_{T}^{assoc}$ > 0.3 GeV/c)
|

|
| Near-side width comparison between measured Ds-h and PYTHIA8 predictions ($p_{T}^{assoc}$ > 0.3 GeV/c)
|

|
| Comparison between measured Ds-h and D+-h azimuthal correlation distributions (5 < $p_{T}$ < 8 GeV/c)
|

|
| Comparison between measured Ds-h and D+-h azimuthal correlation distributions (3 < $p_{T}$ < 5 GeV/c)
|

|
| Comparison between measured Ds-h azimuthal correlation distribution and PYTHIA8 predictions (1 < $p_{T}$ < 3 GeV/c)
|

|
| Comparison between measured Ds-h azimuthal correlation distribution and PYTHIA8 predictions (3 < $p_{T}$ < 5 GeV/c)
|

|
| Comparison between measured Ds-h azimuthal correlation distribution and PYTHIA8 predictions (5 < $p_{T}$ < 8 GeV/c)
|

|
| Comparison between measured Ds-h azimuthal correlation distribution and PYTHIA8 predictions (8 < $p_{T}$ < 16 GeV/c)
|

|
| Comparison between measured Ds-h azimuthal correlation distribution and PYTHIA8 predictions (16 < $p_{T}$ < 36 GeV/c)
|

|
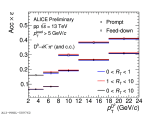
| Cut variation of $\Lambda_c$ in pt 2 to 3 geV/c in pp collisions at 13.6 TeV
|

|
| p-$\Lambda_c$ inv.mass in mixed-event in pp collisions at 13.6 TeV
|

|
| p-$\Lambda_c$ inv.mass in same-event in pp collisions at 13.6 TeV
|

|
| p-$\Lambda_c$ raw correlation function compare with models included strong interaction in pp collisions at 13.6 TeV
|

|
| p-$\Lambda_c$ raw correlation function fit decomposition in pp collisions at 13.6 TeV
|

|
| p-$\Lambda_c$ raw correlation function fit with coulomb only and background in pp collisions at 13.6 TeV
|

|
| Ds1+/Ds ratio, (BR factorized)
|

|
| Ds2*/Ds ratio, (BR factorized)
|

|
| Ds2*/Ds ratio
|

|
| Ds1+/Ds ratio
|
|
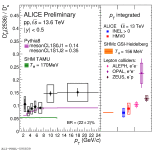
| Ds, Ds1+ and Ds2* cross section
|

|
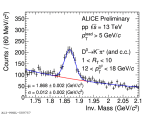
| Ds1+ Invariant Mass 2<pT<3 GeV/c
|

|
| Ds1+ Invariant Mass 6<pT<8 GeV/c
|

|
| Ds1+ Invariant Mass 12<pT<24 GeV/c
|

|
| Ds2* Invariant Mass 12<pT<24 GeV/c
|

|
| Ds2* Invariant Mass 6<pT<8 GeV/c
|

|
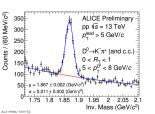
| Ds2* Invariant Mass 2<pT<4 GeV/c
|

|
| Ratio of EECs in p-Pb and pp in different jet pT bins (20-27, 27-40, 40-80 GeV)
|

|
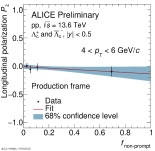
| Longitudinal polarization ($P_{\rm z}$) of prompt and non-prompt $\Lambda_{\rm c}^+$ and $\bar{\Lambda}_{\rm c}^-$ in pp collisions at $\sqrt{s} = 13.6$ TeV (production frame)
|

|
| Longitudinal polarization as a function of non-prompt fraction for $\Lambda_{\rm c}^+$ and $\bar{\Lambda}_{\rm c}^-$ in pp collisions at $\sqrt{s} = 13.6$ TeV (production frame)
|
|
| Simultaneous fit of $\Lambda_{\rm c}^+$ and $\bar{\Lambda}_{\rm c}^-$ corrected yield as a function of $\cos(\theta^*)$ in pp collisions at $\sqrt{s} = 13.6$ TeV (production frame)
|

|
| Invariant mass distribution of ${\rm pK}\pi$ triplets in pp collisions at $\sqrt{s} = 13.6$ TeV in two intervals of $\cos(\theta^*)$ (production frame)
|

|
| Ratio of the $R_{\rm T}$-dependent per-event D$^0$ meson yields to the $R_{\rm T}$-integrated yield in the toward region
|

|
| Acceptance-times-efficiency correction of D$^0$ mesons as a function of the $R_{\rm T}$
|
|
| Invariant mass distribution of D$^0$ candidates with 12 < $p_{\rm T}^{\rm D^0}$ < 18 GeV/$c$ in $R_{\rm T}$ > 1 events
|
|
| Invariant mass distribution of D$^0$ candidates with 5 < $p_{\rm T}^{\rm D^0}$ < 8 GeV/$c$ in $R_{\rm T}$ < 1 events
|
|
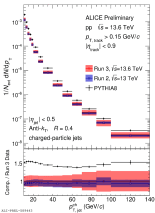
| Inclusive charged-particle jet invariant yield in pp collisions at \sqrt{s} = 13.6 TeV
|
|
| Inclusive charged-particle jet cross section in pp collisions at \sqrt{s} = 13.6 TeV
|

|
| Ratio of EEC distributions for charged jets in pp and p-Pb collisions -- 20-40 GeV/c with fit
|

|
| p/pi in jets 3 curves
|

|
| K/pi in jets 3 curves
|

|
| pi spectra inclusive, jet+UE, UE
|

|
| pi spectra inclusive and jet+UE
|

|
| pi spectra inclusive only
|

|
| p/pi in jets all 5 curves
|

|
| K/pi in jets all 5 curves
|

|
| p in jets spectra
|

|
| K in jets spectra
|
|
| pi in jets spectra - all four curves
|

|
| nSD of D0-tagged jets in pp at 13.6 TeV for jet pT 15-30 GeV/c compared with Run 2 results
|

|
| Rg of D0-tagged jets in pp at 13.6 TeV for jet pT 15-30 GeV/c compared with Run 2 results
|

|
| nSD of D0-tagged jets in pp at 13.6 TeV for jet pT 30-50 GeV/c
|

|
| nSD of D0-tagged jets in pp at 13.6 TeV for jet pT 15-30 GeV/c
|

|
| Rg of D0-tagged jets in pp at 13.6 TeV for jet pT 30-50 GeV/c
|

|
| Rg of D0-tagged jets in pp at 13.6 TeV for jet pT 15-30 GeV/c
|

|
| nSD of D0-tagged jets in pp at 13.6 TeV compared with Run 2 results
|

|
| nSD of D0-tagged jets in pp at 13.6 TeV
|

|
| Rg of D0-tagged jets in pp at 13.6 TeV compared with Run 2 results
|

|
| Rg of D0-tagged jets in pp at 13.6 TeV
|

|
| Ratio of EEC distributions for charged jets in pp and p-Pb collisions -- 20-40 GeV/c with HT calculation
|

|
| Ratio of EEC distributions for charged jets in pp and p-Pb collisions -- 20-40 GeV/c with model+nPDF bands
|

|
| zg of D0-tagged jets in pp at 13.6 TeV for jet pT 15-30 GeV/c compared with Run 2 results
|

|
| $\Lambda_{\text{c}}^{+}$ fragmentation function in pp at 13.6 TeV compared with Run 2 results
|

|
| zg of D0-tagged jets in pp at 13.6 TeV for jet pT 30-50 GeV/c
|

|
| zg of D0-tagged jets in pp at 13.6 TeV for jet pT 15-30 GeV/c
|

|
| zg of D0-tagged jets in pp at 13.6 TeV compared with Run 2 results
|

|
| zg of D0-tagged jets in pp at 13.6 TeV
|

|
| $\Lambda_{\text{c}}^{+}$ fragmentation function in pp at 13.6 TeV vs $\text{D}^{0}$
|

|
| $\Lambda_{\text{c}}^{+}$ fragmentation function in pp at 13.6 TeV
|

|
| Ratio of EECs in p-Pb/pp for 60-80 GeV/c jets
|

|
| Ratio of EECs in p-Pb/pp for 40-60 GeV/c jets
|

|
| Ratio of EECs in p-Pb/pp for 20-40 GeV/c jets
|

|
| Fitted EEC peak heights in p-Pb
|

|
| Fitted EEC peak positions in p-Pb
|

|
| Fit of EECs for 60-80 GeV/c jets in p-Pb -- x (R_{L}) axis scaled by average jet pt
|

|
| Fit of EECs for 40-60 GeV/c jets in p-Pb -- x (R_{L}) axis scaled by average jet pt
|

|
| Fit of EECs for 20-40 GeV/c jets in p-Pb -- x (R_{L}) axis scaled by average jet pt
|

|
| Ratio of EECs in p-Pb/pp for 60-80 GeV/c jets with varying track pT cut (150 MeV, 1 GeV, 2 GeV)
|

|
| Ratio of EECs in p-Pb/pp for 40-60 GeV/c jets with varying track pT cut (150 MeV, 1 GeV, 2 GeV)
|

|
| EEC distributions in p-Pb with varying track pT cut (150 MeV, 1 GeV, 2 GeV) for 60-80 GeV/c jets
|

|
| EEC distributions in p-Pb with varying track pT cut (150 MeV, 1 GeV, 2 GeV) for 40-60 GeV/c jets
|

|
| EEC distributions in p-Pb with varying track pT cut (150 MeV, 1 GeV, 2 GeV) for 20-40 GeV/c jets
|

|
| Comparison of EEC distributions for charged jets in pp and p-Pb collisions -- 60-80 GeV/c
|

|
| Comparison of EEC distributions for charged jets in pp and p-Pb collisions -- 40-60 GeV/c
|

|
| Comparison of EEC distributions for charged jets in pp and p-Pb collisions -- 20-40 GeV/c
|

|
| R-ratio of R=0.2/R=0.4 recoil jets as a function of pT in 13.6 TeV with PYTHIA comparison
|

|
| R-ratio of R=0.2/R=0.4 recoil jets as a function of pT in 13.6 TeV
|

|
| R-ratio of R=0.2/R=0.4 recoil jets as a function of pT in 13.6 TeV, just Run 3 data
|

|
| Raw spectra of signal, reference and delta recoil vs pT for R=0.4 jets
|

|
| Delta recoil vs pT with PYTHIA comparison for R=0.4 jets in 13.6 TeV pp collisions
|

|
| Delta recoil vs pT with PYTHIA comparison for R=0.2 jets in 13.6 TeV pp collisions
|

|
| Delta recoil vs pT for R=0.4 jets in 13.6 TeV pp collisions
|

|
| Delta recoil vs pT for R=0.2 jets in 13.6 TeV pp collisions
|

|
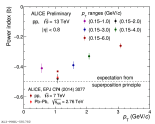
| Evolution of power index as a function of $\it{p}_{\rm{T}}$
|
|
| Normalized $\it{p}_{\rm{T}}$ correlator as a function of mean $\it{p}_{\rm{T}}$ for fixed $\it{p}_{\rm{T}}$ window sliding from lower to higher $\it{p}_{\rm{T}}$
|

|
| Normalized $\it{p}_{\rm{T}}$ correlator as a function of mean $\it{p}_{\rm{T}}$ with increasing upper limit of $\it{p}_{\rm{T}}$ windows
|

|
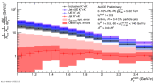
| Relative uncertainties of inclusive charged-particle jet cross section in pp collisions at \sqrt{s} = 13.6 TeV
|

|
| Comparison of Pythia8 (Monash) and EPOS models to normalized mean $\it{p}_{\rm{T}}$ correlator as charged particle multiplicity at fixed $\it{p}_{\rm{T}}$ window sliding from lower to higher $\it{p}_{\rm{T}}$
|

|
| Comparison of Pythia8 (Monash) and EPOS models to normalized mean $\it{p}_{\rm{T}}$ correlator as charged particle multiplicity for increasing upper limit of $\it{p}_{\rm{T}}$ windows
|

|
| Empirical power law fit to normalized $\it{p}_{\rm{T}}$ correlator as a function of charged particle multiplicity
|

|