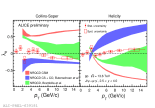
| Comparison of lambda theta polarization parameters as a function of pT in pp 13.6 TeV with NRQCD model
|
|
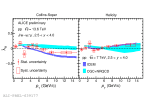
| Comparison of lambda theta polarization parameters as a function of pT in pp 13.6 TeV with ICEM and CGC+NRQCD model
|
|
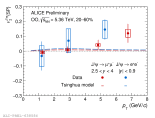
| J/$\psi$ $\nu_{2}$ vs pT in OO collisions at $\sqrt{s_{\mathrm{NN}}}$ = 5.36 TeV in the dimuon channel at forward rapidity in the centrality class 20-60% vs midrapidity and models
|
|
| J/$\psi$ $\nu_{2}$ vs pT in OO collisions at $\sqrt{s_{\mathrm{NN}}}$ = 5.36 TeV in the dimuon channel at forward rapidity in the centrality class 0-20% vs midrapidity and models
|

|
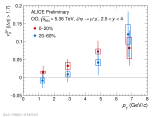
| J/$\psi$ $\nu_{2}$ vs pT in OO collisions at $\sqrt{s_{\mathrm{NN}}}$ = 5.36 TeV in the dimuon channel at forward rapidity in the centrality classes 0-20% and 20-60%
|
|
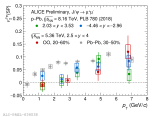
| J/$\psi$ $\nu_{2}$ vs pT in OO collisions at $\sqrt{s_{\mathrm{NN}}}$ = 5.36 TeV in the dimuon channel at forward rapidity in the centrality class 20-60% vs p-Pb, Pb-p and Pb-Pb
|
|
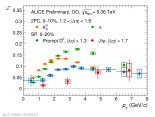
| J/$\psi$ $\nu_{2}$ vs pT in OO collisions at $\sqrt{s_{\mathrm{NN}}}$ = 5.36 TeV in the dimuon channel at forward rapidity in the centrality class 0-20% vs LF and HF
|
|
| J/$\psi$ $\nu_{2}$ vs pT in OO collisions at $\sqrt{s_{\mathrm{NN}}}$ = 5.36 TeV in the dimuon channel at forward rapidity in the centrality class 0-20% vs Pb-Pb collisions in 0-10%
|

|
| J/$\psi$ $\nu_{2}$ vs pT in OO collisions at $\sqrt{s_{\mathrm{NN}}}$ = 5.36 TeV in the dimuon channel at forward rapidity in the centrality class 20-60% vs Pb-Pb collisions in 30-50%
|

|
| J/$\psi$ $\nu_{2}$ vs pT in OO collisions at $\sqrt{s_{\mathrm{NN}}}$ = 5.36 TeV in the dimuon channel at forward rapidity in the centrality class 20-60% vs midrapidity
|

|
| J/$\psi$ $\nu_{2}$ vs pT in OO collisions at $\sqrt{s_{\mathrm{NN}}}$ = 5.36 TeV in the dimuon channel at forward rapidity in the centrality class 0-20% vs midrapidity
|

|
| J/$\psi$ $\nu_{2}$ vs pT in OO collisions at $\sqrt{s_{\mathrm{NN}}}$ = 5.36 TeV in the dimuon channel at forward rapidity in the centrality class 0-20% vs Tsinghua transport model
|

|
| J/$\psi$ $\nu_{2}$ vs pT in OO collisions at $\sqrt{s_{\mathrm{NN}}}$ = 5.36 TeV in the dimuon channel at forward rapidity in the centrality class 20-60% vs Tsinghua transport model
|

|
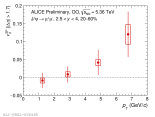
| J/$\psi$ $\nu_{2}$ vs pT in OO collisions at $\sqrt{s_{\mathrm{NN}}}$ = 5.36 TeV in the dimuon channel at forward rapidity in the centrality class 20-60%
|
|
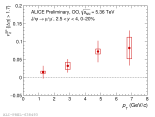
| J/$\psi$ $\nu_{2}$ vs pT in OO collisions at $\sqrt{s_{\mathrm{NN}}}$ = 5.36 TeV in the dimuon channel at forward rapidity in the centrality class 0-20%
|
|
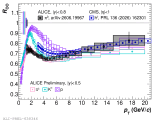
| Compilation of All Available Non-Strange Nuclear Modification Factors ROO - Linear pT Axis
|
|
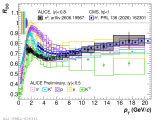
| Compilation of All Available Nuclear Modification Factors ROO - Linear pT Axis
|
|
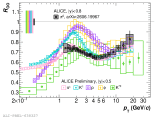
| Compilation of All Available Identified Particle Nuclear Modification Factors ROO
|
|
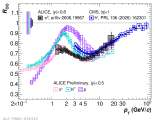
| Compilation of All Available Non-Strange Nuclear Modification Factors ROO
|
|
| Compilation of All Available Nuclear Modification Factors ROO
|
|
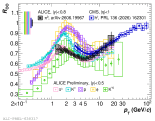
| Ds-h azimuthal correlation away-side IAA
|
|
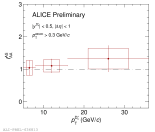
| Ds-h azimuthal correlation near-side IAA
|
|
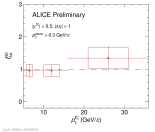
| Ds-h azimuthal correlation near-side width comparison between pp and OO collisions
|
|
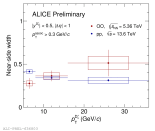
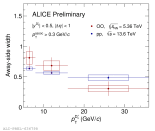
| Ds-h azimuthal correlation away-side width comparison between pp and OO collisions
|
|
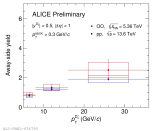
| Ds-h azimuthal correlation away-side yield comparison between pp and OO collisions
|
|
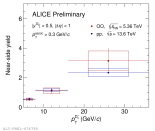
| Ds-h azimuthal correlation near-side yield comparison between pp and OO collisions
|
|
| Ds-h azimuthal correlation distribution comparison between pp and OO collisions (5 < $p_{T}$ < 8 GeV/c)
|

|
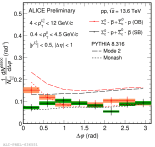
| Opposite-baryon and same-baryon $\Sigma_{\rm c}^{0}\text{--p}$ azimuthal correlations for $4 < p_{\mathrm{T}}(\Sigma_{\rm c}^{0}) < 12$ GeV/$c$ and $0.4 < p_{\mathrm{T}}(\text{p}) < 4.5$ GeV/$c$ compared with models
|
|
| Opposite-baryon and same-baryon $\Sigma_{\rm c}^{++}\text{--p}$ azimuthal correlations for $4 < p_{\mathrm{T}}(\Sigma_{\rm c}^{++}) < 12$ GeV/$c$ and $0.4 < p_{\mathrm{T}}(\text{p}) < 4.5$ GeV/$c$ compared with models
|

|
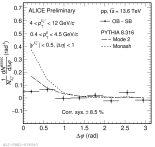
| Opposite-baryon$-$ same-baryon $\Sigma_{\rm c}^{++}\text{--p}$ azimuthal correlations for $4 < p_{\mathrm{T}}(\Sigma_{\rm c}^{++}) < 12$ GeV/$c$ and $0.4 < p_{\mathrm{T}}(\text{p}) < 4.5$ GeV/$c$ compared with models
|
|
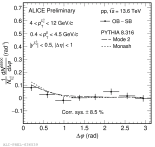
| Opposite baryon $-$ same-baryon $\Sigma_{\rm c}^{0}\text{--p}$ azimuthal correlations for $4 < p_{\mathrm{T}}(\Sigma_{\rm c}^{0}) < 12$ GeV/$c$ and $0.4 < p_{\mathrm{T}}(\text{p}) < 4.5$ GeV/$c$ compared with models
|
|
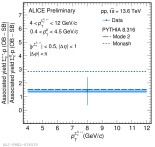
| Ratio of associated $\Sigma_{\rm c}^{++}\text{--p}$ over $\Sigma_{\rm c}^{0}\text{--p}$ yield for $4 < p_{\mathrm{T}}(\Sigma_{\rm c}^{0, ++}) < 12$ GeV/$c$ and $0.4 < p_{\mathrm{T}}(\text{p}) < 4.5$ GeV/$c$ compared with models
|
|
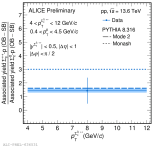
| Ratio of associated near-side $\Sigma_{\rm c}^{++}\text{--p}$ over $\Sigma_{\rm c}^{0}\text{--p}$ yield for $4 < p_{\mathrm{T}}(\Sigma_{\rm c}^{0, ++}) < 12$ GeV/$c$ and $0.4 < p_{\mathrm{T}}(\text{p}) < 4.5$ GeV/$c$ compared with models
|
|
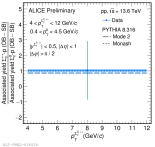
| Ratio of associated away-side $\Sigma_{\rm c}^{++}\text{--p}$ over $\Sigma_{\rm c}^{0}\text{--p}$ yield for $4 < p_{\mathrm{T}}(\Sigma_{\rm c}^{0, ++}) < 12$ GeV/$c$ and $0.4 < p_{\mathrm{T}}(\text{p}) < 4.5$ GeV/$c$ compared with models
|
|
| Associated away-side $\Delta\varphi$ $\Sigma_{\rm c}^{0, ++}$-p yield in $p_{\mathrm{T}}^{\Sigma_{\rm c}^{0, ++}} 4$-$12$ GeV/$c$ and $p_{\mathrm{T}}^{p} 0.4$-$4.5$ GeV/$c$ with models
|
|
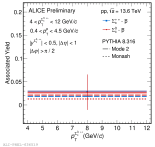
| Associated Near-side $\Delta\varphi$ $\Sigma_{\rm c}^{0, ++}$-p yield in $p_{\mathrm{T}}^{\Sigma_{\rm c}^{0, ++}} 4$-$12$ GeV/$c$ and $p_{\mathrm{T}}^{p} 0.4$-$4.5$ GeV/$c$ with models
|

|
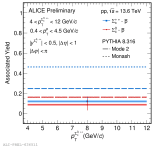
| Associated $\Delta\varphi$ integrated $\Sigma_{\rm c}^{0, ++}$-p yield in $p_{\mathrm{T}}^{\Sigma_{\rm c}^{0, ++}} 4$-$12$ GeV/$c$ and $p_{\mathrm{T}}^{p} 0.4$-$4.5$ GeV/$c$ with models
|
|
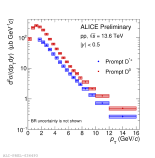
| Overlay of prompt $D^{*+}$ and $D^{0}$ cross sections in pp collisions at $\sqrt{s}$ = 13.6 TeV
|
|
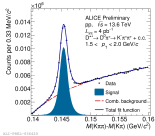
| Fit to the invariant-mass distribution of prompt $D^{*+}$ in the $1.5 < p_{T} < 2 \text{GeV}/c$ interval, in pp collisions at $\sqrt{s}$ = 13.6 TeV
|
|
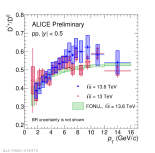
| $D^{*+}/D^{0}$ ratio in pp collisions at $\sqrt{s}$ = 13.6 TeV
|
|
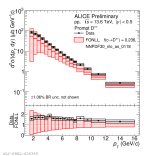
| Prompt $D^{*+}$ cross section in pp collisions at $\sqrt{s}$ = 13.6 TeV compared with FONLL
|
|
| Prompt $D^{*+}$ cross section in pp collisions at $\sqrt{s}$ = 13.6 TeV compared with Run 2 measurement
|

|
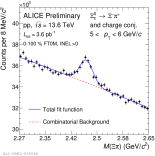
| Raw yield of Xic0 in pT bin [5, 6] GeV/c for the 0–100% FT0M, 0>INEL
|
|
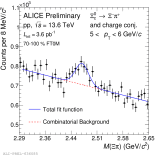
| Raw yield of Xic0 in pT bin [5, 6] GeV/c for the 70–100% FT0M multiplicity class
|
|
| Xic0 self-normalized yields in pp collisions at 13.6 TeV compare with EPOS4HQ
|

|
| Xic0 self-normalized yields in pp collisions at 13.6 TeV compare with Pythia
|

|
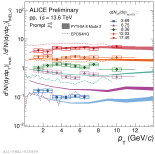
| Xic0 self-normalized yields in pp collisions at 13.6 TeV
|
|
| ψ(2S)-to-J/ψ ratio vs Npart in Run 3 OO collisions in the dimuon channel at forward rapidity NOT in log scale
|

|
| ψ(2S)-to-J/ψ ratio vs Npart in Run 3 OO collisions in the dimuon channel at forward rapidity
|

|
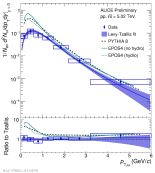
| Spectrum of omega measured in the dielectron channel
|
|
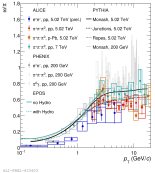
| Ratio of omega/pi as a function of pT
|
|
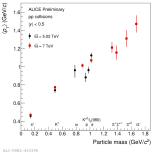
| mean pt of omega and other particles vs mass
|
|
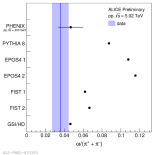
| Integrated omega/pi ratio with models
|
|
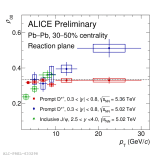
| $\rho_{00}$ of prompt $\mathrm{D}^{*+}$ in Pb-Pb collisions at $\sqrt{s_{\mathrm{NN}}}$ = 5.36 TeV, compared to previous measurement of $\mathrm{D}^{*+}$ and inclusive $J/\psi$ at $\sqrt{s_{\mathrm{NN}}}$ = 5.02TeV
|
|
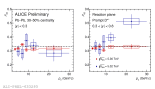
| $\rho_{00}$ of prompt $\mathrm{D}^{*+}$ in Pb-Pb collisions at $\sqrt{s_{\mathrm{NN}}}$ = 5.36 TeV, compared with previous measurement at $\sqrt{s_{\mathrm{NN}}}$ = 5.02TeV
|
|
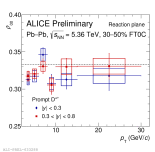
| $\rho_{00}$ of prompt $\mathrm{D}^{*+}$ in Pb-Pb collisions at $\sqrt{s_{\mathrm{NN}}}$ = 5.36 TeV
|
|
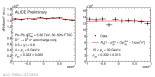
| Fit of corrected $\mathrm{D}^{*+}$ mesons yield as a function of $cos\theta^*$ in Pb-Pb collisions with two $p_\mathrm{T}$ intervals
|
|
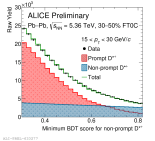
| Raw yield as a function of BDT selections and extracted contributions from prompt and non-prompt $\mathrm{D}^{*+}$ mesons with $15<p_\mathrm{T}<30~\mathrm{GeV}/c$
|
|
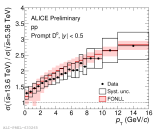
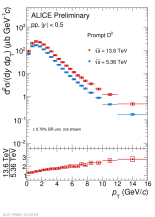
| Ratio of the prompt $\mathrm{D}^{0}$ production cross section in pp collisions at $\sqrt{s}=13.6~\mathrm{TeV}$ to that at $\sqrt{s}=5.36~\mathrm{TeV}$ as a function of $p_{\mathrm{T}}$, compared with the FONLL prediction.
|
|
| Prompt $\mathrm{D}^0$ cross section in pp collisions at $\sqrt{s} = 5.36\ \mathrm{TeV}$ compared with $\sqrt{s} = 13.6\ \mathrm{TeV}$
|
|
| Invariant mass distribution in Pb-Pb collisions at $\sqrt{s_{\mathrm{NN}}}$ = 5.36 TeV in two intervals of $p_\mathrm{T}$
|
|
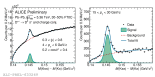
| Fit to the invariant-mass distribution of prompt $\mathrm{D}^{0}$ in the $3.5 < p_{\mathrm{T}} < 4 \mathrm{GeV}/c$ interval, in pp collisions at $\sqrt{s} = 5.36 \ \mathrm{TeV}$
|

|
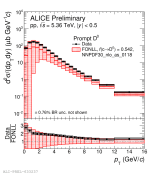
| Prompt $\mathrm{D}^0$ cross section in pp collisions at $\sqrt{s} = 5.36\ \mathrm{TeV}$ compared with FONLL
|
|
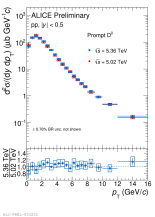
| Prompt $\mathrm{D}^0$ cross section in pp collisions at $\sqrt{s} = 5.36\ \mathrm{TeV}$ compared with Run 2 measurement
|
|
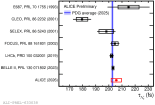
| $\Lambda_{\mathrm{c}}^+$ lifetime: ALICE measurement among world data (uncertainties separated)
|
|
| $\Lambda_{\mathrm{c}}^+$ lifetime: ALICE measurement among world data (uncertainties combined)
|

|
| $\Lambda_{\mathrm{c}}^+$ proper decay time fit
|

|
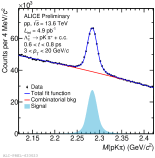
| $\Lambda_{\mathrm{c}}^+\rightarrow\mathrm{pK^-}\pi^+$ invariant mass fit
|
|
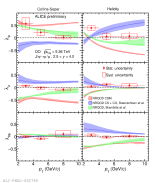
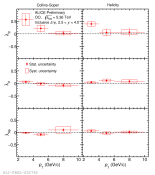
| Comparison of J/psi polarization parameters in OO at 5.36 TeV with different NRQCD model prediction
|
|
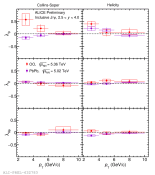
| Comparison of J/psi polarization parameters in OO at 5.36 TeV with PbPb at 5.02 TeV
|
|
| J/psi polarization parameters as a function of pT in OO collision at 5.36 TeV
|
|
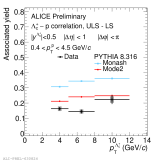
| Associated $\Delta\varphi$ integrated $\Lambda_{c}$-p yield in $p_{\mathrm{T}}^{\Lambda_{c}} 3$-$12$ GeV/$c$ and $p_{\mathrm{T}}^{p} 0.4$-$4.5$ GeV/$c$ with models
|
|
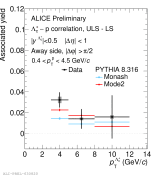
| Associated away-side peak yield $\Lambda_{c}$-pyield in $p_{\mathrm{T}}^{\Lambda_{c}} 3$-$12$ GeV/$c$ and $p_{\mathrm{T}}^{p} 0.4$-$4.5$ GeV/$c$ with models
|
|
| Associated near-side peak yield $\Lambda_{c}$-pyield in $p_{\mathrm{T}}^{\Lambda_{c}} 3$-$12$ GeV/$c$ and $p_{\mathrm{T}}^{p} 0.4$-$4.5$ GeV/$c$ with models
|

|
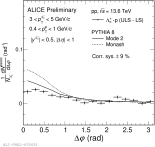
| Unlike-sign - like-sign $\Lambda_{c}$-p Azimuthal Correlations in $p_{\mathrm{T}}^{\Lambda_{c}} 3$-$5$ GeV/$c$ and $p_{\mathrm{T}}^{p} 0.4$-$1.0$ GeV/$c$ with models
|
|
| Unlike-sign - like-sign $\Lambda_{c}$-p Azimuthal Correlations in $p_{\mathrm{T}}^{\Lambda_{c}} 3$-$5$ GeV/$c$ and $p_{\mathrm{T}}^{p} 1.0$-$2.5$ GeV/$c$ with models
|

|
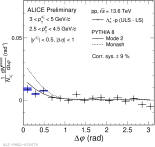
| Unlike-sign - like-sign $\Lambda_{c}$-p Azimuthal Correlations in $p_{\mathrm{T}}^{\Lambda_{c}} 3$-$5$ GeV/$c$ and $p_{\mathrm{T}}^{p} 2.5$-$4.5$ GeV/$c$ with models
|
|
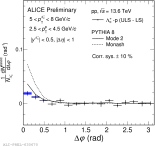
| Unlike-sign - like-sign $\Lambda_{c}$-p Azimuthal Correlations in $p_{\mathrm{T}}^{\Lambda_{c}} 5$-$8$ GeV/$c$ and $p_{\mathrm{T}}^{p} 2.5$-$4.5$ GeV/$c$ with models
|
|
| Unlike-sign - like-sign $\Lambda_{c}$-p Azimuthal Correlations in $p_{\mathrm{T}}^{\Lambda_{c}} 5$-$8$ GeV/$c$ and $p_{\mathrm{T}}^{p} 1.0$-$2.5$ GeV/$c$ with models
|

|
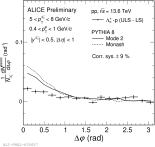
| Unlike-sign - like-sign $\Lambda_{c}$-p Azimuthal Correlations in $p_{\mathrm{T}}^{\Lambda_{c}} 5$-$8$ GeV/$c$ and $p_{\mathrm{T}}^{p} 0.4$-$1.0$ GeV/$c$ with models
|
|
| Unlike-sign - like-sign $\Lambda_{c}$-p Azimuthal Correlations in $p_{\mathrm{T}}^{\Lambda_{c}} 8$-$12$ GeV/$c$ and $p_{\mathrm{T}}^{p} 0.4$-$1.0$ GeV/$c$ with models
|

|
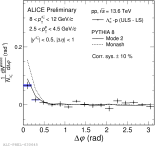
| Unlike-sign - like-sign $\Lambda_{c}$-p Azimuthal Correlations in $p_{\mathrm{T}}^{\Lambda_{c}} 8$-$12$ GeV/$c$ and $p_{\mathrm{T}}^{p} 2.5$-$4.5$ GeV/$c$ with models
|
|
| Unlike-sign - like-sign $\Lambda_{c}$-p Azimuthal Correlations in $p_{\mathrm{T}}^{\Lambda_{c}} 8$-$12$ GeV/$c$ and $p_{\mathrm{T}}^{p} 1.0$-$2.5$ GeV/$c$ with models
|

|
| Unlike-sign - like-sign $\Lambda_{c}$-p Azimuthal Correlations in $p_{\mathrm{T}}^{\Lambda_{c}} 12$-$24$ GeV/$c$ and $p_{\mathrm{T}}^{p} 1.0$-$2.5$ GeV/$c$ with models
|

|
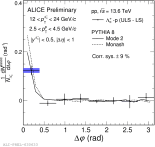
| Unlike-sign - like-sign $\Lambda_{c}$-p Azimuthal Correlations in $p_{\mathrm{T}}^{\Lambda_{c}} 12$-$24$ GeV/$c$ and $p_{\mathrm{T}}^{p} 2.5$-$4.5$ GeV/$c$ with models
|
|
| Like-sign and Unlike-sign $\Lambda_{c}$-p Azimuthal Correlations in $p_{\mathrm{T}}^{\Lambda_{c}} 12$-$24$ GeV/$c$ and $p_{\mathrm{T}}^{p} 1.0$-$2.5$ GeV/$c$ with models
|

|
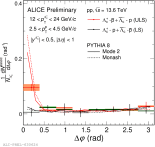
| Like-sign and Unlike-sign $\Lambda_{c}$-p Azimuthal Correlations in $p_{\mathrm{T}}^{\Lambda_{c}} 12$-$24$ GeV/$c$ and $p_{\mathrm{T}}^{p} 2.5$-$4.5$ GeV/$c$ with models
|
|
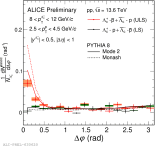
| Like-sign and Unlike-sign $\Lambda_{c}$-p Azimuthal Correlations in $p_{\mathrm{T}}^{\Lambda_{c}} 8$-$12$ GeV/$c$ and $p_{\mathrm{T}}^{p} 2.5$-$4.5$ GeV/$c$ with models
|
|
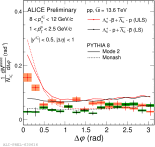
| Like-sign and Unlike-sign $\Lambda_{c}$-p Azimuthal Correlations in $p_{\mathrm{T}}^{\Lambda_{c}} 8$-$12$ GeV/$c$ and $p_{\mathrm{T}}^{p} 1.0$-$2.5$ GeV/$c$ with models
|
|
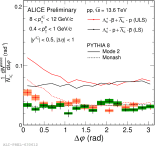
| Like-sign and Unlike-sign $\Lambda_{c}$-p Azimuthal Correlations in $p_{\mathrm{T}}^{\Lambda_{c}} 8$-$12$ GeV/$c$ and $p_{\mathrm{T}}^{p} 0.4$-$1.0$ GeV/$c$ with models
|
|
| Like-sign and Unlike-sign $\Lambda_{c}$-p Azimuthal Correlations in $p_{\mathrm{T}}^{\Lambda_{c}} 5$-$8$ GeV/$c$ and $p_{\mathrm{T}}^{p} 0.4$-$1.0$ GeV/$c$ with models
|

|
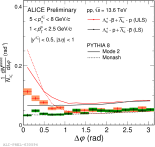
| Like-sign and Unlike-sign $\Lambda_{c}$-p Azimuthal Correlations in $p_{\mathrm{T}}^{\Lambda_{c}} 5$-$8$ GeV/$c$ and $p_{\mathrm{T}}^{p} 1.0$-$2.5$ GeV/$c$ with models
|
|
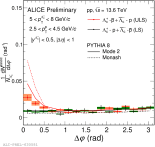
| Like-sign and Unlike-sign $\Lambda_{c}$-p Azimuthal Correlations in $p_{\mathrm{T}}^{\Lambda_{c}} 5$-$8$ GeV/$c$ and $p_{\mathrm{T}}^{p} 2.5$-$4.5$ GeV/$c$ with models
|
|
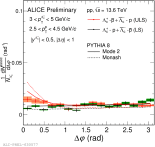
| Like-sign and Unlike-sign $\Lambda_{c}$-p Azimuthal Correlations in $p_{\mathrm{T}}^{\Lambda_{c}} 3$-$5$ GeV/$c$ and $p_{\mathrm{T}}^{p} 2.5$-$4.5$ GeV/$c$ with models
|
|
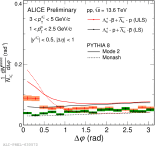
| Like-sign and Unlike-sign $\Lambda_{c}$-p Azimuthal Correlations in $p_{\mathrm{T}}^{\Lambda_{c}} 3$-$5$ GeV/$c$ and $p_{\mathrm{T}}^{p} 1.0$-$2.5$ GeV/$c$ with models
|
|
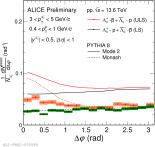
| Like-sign and Unlike-sign $\Lambda_{c}$-p Azimuthal Correlations in $p_{\mathrm{T}}^{\Lambda_{c}} 3$-$5$ GeV/$c$ and $p_{\mathrm{T}}^{p} 0.4$-$1$ GeV/$c$ with models
|
|
| Ds-K ULS-LS near-side yield
|

|
| Ds-$\pi$ ULS-LS azimuthal correlation distribution (5 < $p_{T}$ < 8 GeV/c) comparison with models
|

|
| Ds-K ULS-LS azimuthal correlation distribution (5 < $p_{T}$ < 8 GeV/c) comparison with models
|

|
| Ds-K ULS and LS azimuthal correlation distribution comparison (8 < $p_{T}$ < 16 GeV/c) comparison with models
|

|