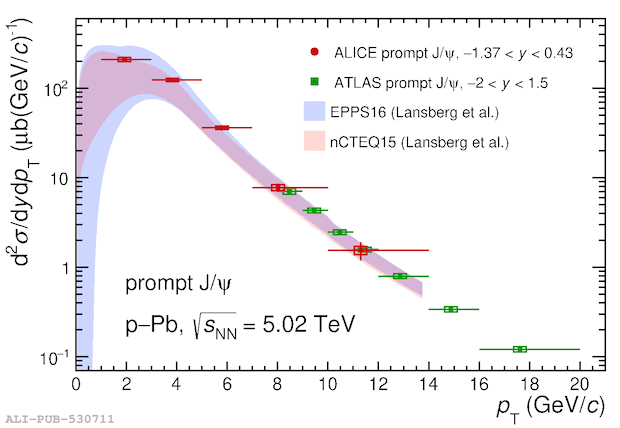
$\textup{d}\sigma_{\rm prompt\ \PJpsi}/\textup{d}y$ as a function of the rapidity in the centre-of-mass frame (left panel) as obtained in this work at midrapidity and by the LHCb collaboration in the forward and backward rapidity regions~, and $\textup{d}^2\sigma_{\rm prompt\ \PJpsi}/\textup{d}y\textup{d}p_{\rm T}$ as a function of \pt (right panel) compared with ATLAS results~ (reported up to $\pt = 20$ GeV/$c$). The vertical error bars and the boxes on top of each point represent the statistical and systematic uncertainties. In the left panel, the systematic uncertainty of the ALICE data point includes also the contribution from the extrapolation procedure to go from the visible region ($\pt>1$~GeV/$c$) to $\pt>0$, as described in the text For the measurements as a function of \pt, the data symbols are placed within each bin at the mean of the \pt distribution determined from MC simulations. The results of a model~ including nuclear shadowing based on the EPPS16~ and nCTEQ15~ nPDFs are shown superimposed on both panels (see text for details). In the right panel, the computations refer only to the ALICE rapidity range.
Figure extracted from paper
