
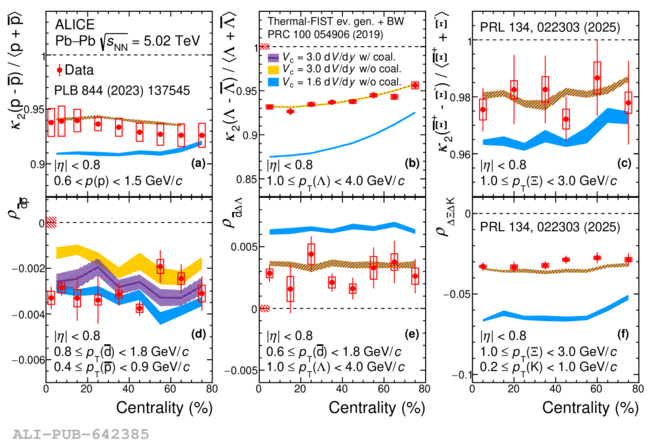
Upper panels: normalized second-order cumulants \kratioP~, \kratioL, and \kratioX~. Lower panels: Pearson correlation coefficients \rhodp~, \rhodL, and \rhokx~. The results of the analysis described in this Letter are shown in panels (b), (d), and (e): (b) and (e) are obtained from the 2018 data, while (d) is obtained with the combined 2015+2018 data. The observables are measured as a function of centrality in Pb--Pb collisions at $\sqrt{s_{\mathrm{NN}}}=5.02\ \mathrm{TeV}$. The error bars and boxes show the statistical and systematic uncertainties, respectively. For \kratioL, \rhodp, and \rhodL, the boxes and shaded areas indicate the centrality uncorrelated and correlated components of the systematic uncertainty, respectively. The correlated components are centered around the value of the uncorrelated particle-production baseline, which is represented as a dashed black line in each panel The results are compared with model calculations, shown as colored bands, obtained with the Thermal-FIST model~, both with and without nuclear coalescence effects, and for different $V_c$ values. The yellow bands with purple shades correspond to the cases where the calculations with and without coalescence effects coincide. The width of the band represents the statistical uncertainty in the model calculations.
Figure extracted from paper