
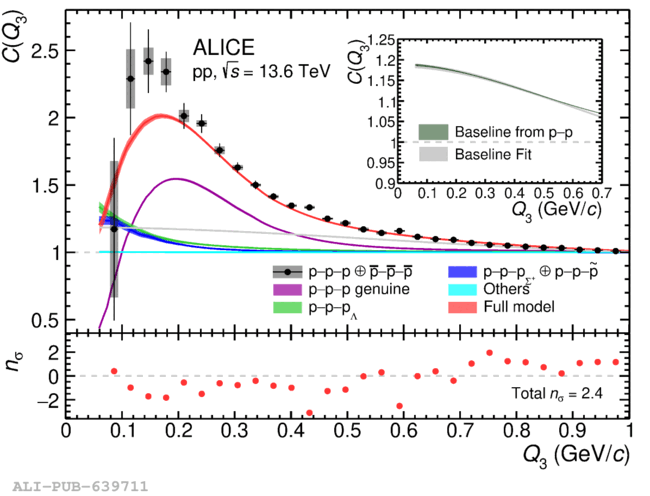
The p--p--p correlation function measured in pp collisions at $\sqrt{s} = 13.6$ TeV, normalized to unity in the range $Q_3 \in [1.0,1.2]$ GeV/$c$. The vertical bars indicate the statistical uncertainties, while the shaded boxes represent the systematic ones. The magenta band represents the genuine p--p--p contribution, and the other colored bands correspond to the different components used in the modeling of the correlation function (see text for details). The red band is the result of the fit. The non-femtoscopic baseline is shown in light gray. The bottom panel reports the number of standard deviations ($n_\sigma$) between the data and the full model in each bin, obtained by combining the corresponding statistical and systematic uncertainties. The inset shows the comparison between the non-femtoscopic baseline obtained from the fit of the p--p--p correlation function (light gray band) and the corresponding result inferred from the two-body p--p measurement (darker green band).
Figure extracted from paper