Scope: PWG
PWG-CF (Flow and Correlations)
Energy
5.02 TeV
System
Pb-Pb
Figure Group
Figure Image

Figure image (.eps)
Figure image (.pdf)
Figure Caption
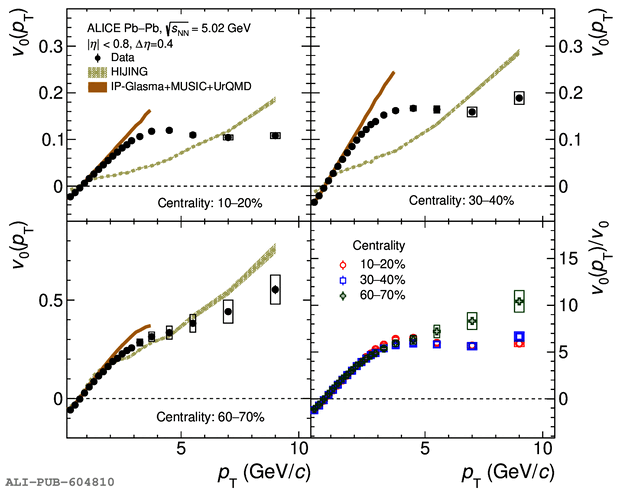
$v_{0}(p_\mathrm{T})$ of inclusive charged particles shown as a function of $p_\mathrm{T}$ in Pb$-$Pb collisions at $\sqrt{s_\mathrm{NN}} = 5.02$ TeV for centrality intervals 10$-$20\% (top left), 30$-$40\% (top right), and 60$-$70\% (bottom left). The measurements are compared to expectations from HIJING~ and IP-Glasma+MUSIC+UrQMD~ models. $v_{0}(p_\mathrm{T})/v_{0}$ of inclusive charged particles shown as a function of $p_\mathrm{T}$ for the centrality intervals (bottom right). The statistical (systematic) uncertainties are represented by vertical bars (boxes).
Detail description
Figure extracted from paper
