Scope: PWG
PWG-EM (Electromagnetic probes)
Energy
13 TeV
System
p-p
Figure Image

Figure image (.eps)
Figure image (.pdf)
Figure Caption
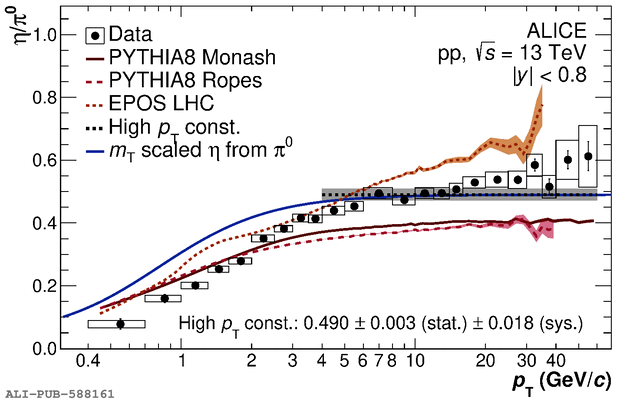
Left: the \etopi~ratio as a function of \pT compared to expectations from PYTHIA8, EPOS LHC, and \mT scaling. Right: Ratio of data and model predictions to the respective \mT scaling prediction.
Detail description
Figure extracted from paper
