Scope: PWG
PWG-CF (Flow and Correlations)
Energy
13 TeV
System
p-p
Figure Image

Figure image (.eps)
Figure image (.pdf)
Figure Caption
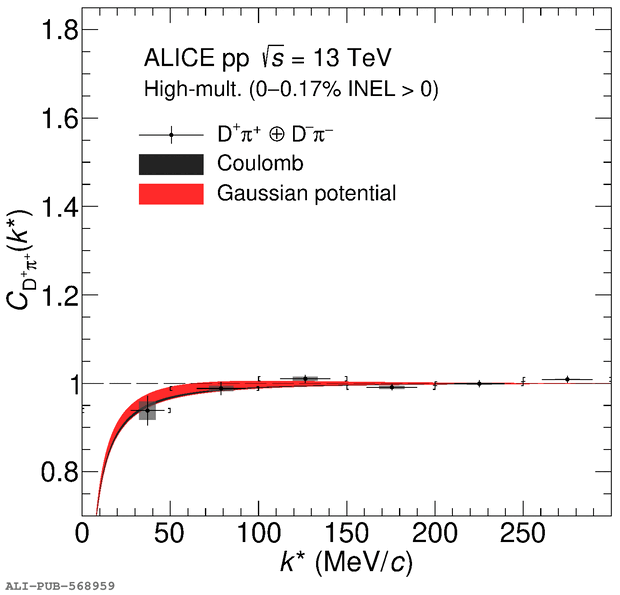
Comparison of the \DPi (first row) and \DstarPi (second row) genuine correlation functions of same- (left column) and opposite-charge (right column) combinations with the results of the $\chi^2$ minimization using a Gaussian potential to parameterize the strong interaction (red band). The width of the band corresponds to the total uncertainty. The gray curve represents the correlation functions assuming only interaction via the Coulomb force.
Detail description
Figure extracted from paper
