Scope: PWG
PWG-LF (Light Flavour Spectra)
Energy
5.02 TeV
System
Pb-Pb
Figure Group
Figure Image

Figure image (.eps)
Figure image (.pdf)
Figure Caption
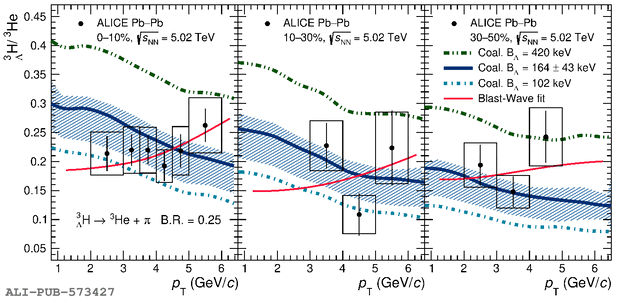
The $\hyp/\he$ yield ratio together with theoretical predictions in different centrality intervals as a function of \pt. The vertical lines and boxes represent the statistical and systematic uncertainties, respectively. The pink solid lines are calculated as the ratios of the Blast-Wave fit functions for \he and \hyp. The other three curves stand for the predictions of the coalescence model with different $B_\Lambda$ hypotheses. The coalescence prediction with world average $B_\Lambda$ is displayed with a 1$\sigma$ uncertainty band~.
Detail description
Figure extracted from paper
