Scope: PWG
PWG-MM (Monte Carlo generators and Minimum Bias)
Energy
5.02 TeV
System
p-p
Pb-Pb
p-Pb
Figure Image

Figure image (.eps)
Figure image (.pdf)
Figure Caption
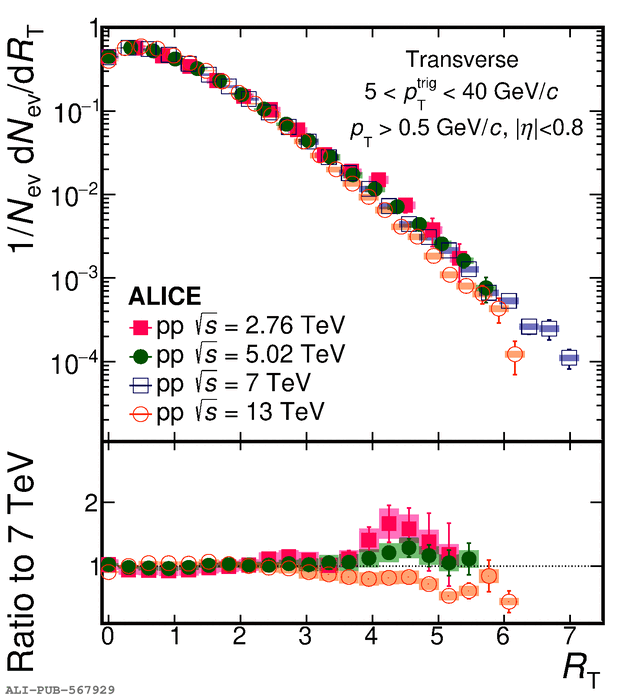
Top: \rt distributions in \pp collisions for different centre-of-mass energies $\s=2.76$, 5.02, 7, and 13\,TeV. Bottom: \rt distributions normalised to that for \pp collisions at $\s=7$\,TeV. The ratio is calculated using a linear interpolation between adjacent points. The boxes and bars represent the systematic and statistical uncertainties, respectively. The pp sample at $\sqrt{s}=13$\,TeV is smaller than that used for pp collisions at $\sqrt{s}=7$\,TeV.
Detail description
Figure extracted from paper
