Scope: PWG
PWG-MM (Monte Carlo generators and Minimum Bias)
Energy
5.02 TeV
System
p-p
p-Pb
Figure Group
Figure Image

Figure image (.eps)
Figure image (.pdf)
Figure Caption
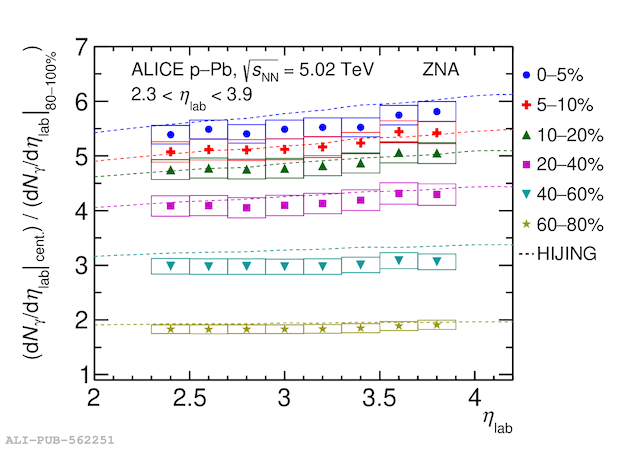
Ratios of \dndetaphotonlab distributions measured in different centrality classes to that in the most peripheral (80--100 \%) centrality class The corresponding \hijing predictions are shown by dotted lines.
Detail description
Figure extracted from paper
