Scope: PWG
PWG-LF (Light Flavour Spectra)
Energy
5.02 TeV
System
Pb-Pb
Figure Image

Figure image (.eps)
Figure image (.pdf)
Figure Caption
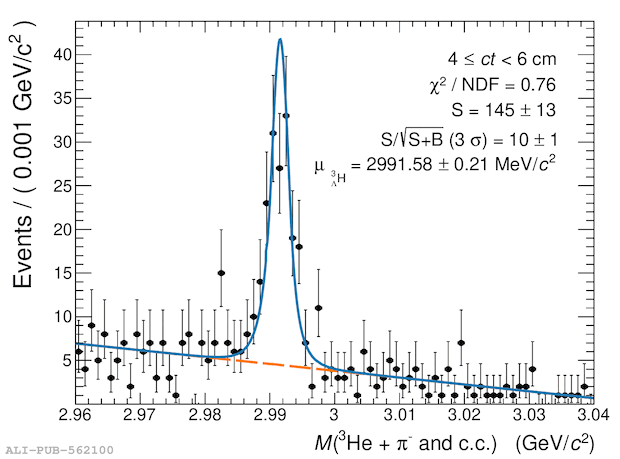
Distribution of the invariant mass of the \hyp and \antihyp candidates in nine \ct intervals from 1 to 35 cm. The statistical uncertainties of the bin counts are represented with vertical lines. The distribution is fitted with a two-component model; the blue line depicts the overall fit, and the orange dashed line displays the background component.
Detail description
Figure extracted from paper
