Scope: PWG
PWG-LF (Light Flavour Spectra)
Energy
5.02 TeV
System
p-Pb
Figure Image

Figure image (.eps)
Figure image (.pdf)
Figure Caption
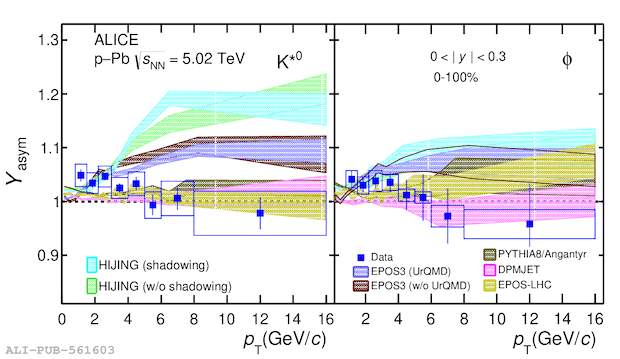
The comparison of experimental results of $Y_\mathrm{asym}$ for \kstar and \phim meson production as a function of $p_\mathrm{T}$ in the rapidity range 0 $ |y| $ 0.3 with the model predictions from EPOS-LHC~, EPOS3 with and without UrQMD~, DPMJET~, HIJING~, and PYTHIA8/Angantyr~. Data points are shown with blue markers, and model predictions are shown by different color bands, where bands represent the statistical uncertainity of the model. The statistical uncertainties on the data points are represented as bars whereas the boxes indicate total systematic uncertainties.
Detail description
Figure extracted from paper
