Scope: PWG
PWG-DQ (Dileptons and Quarkonia)
Energy
5.02 TeV
System
Pb-Pb
Figure Group
Figure Image

Figure image (.eps)
Figure image (.pdf)
Figure Caption
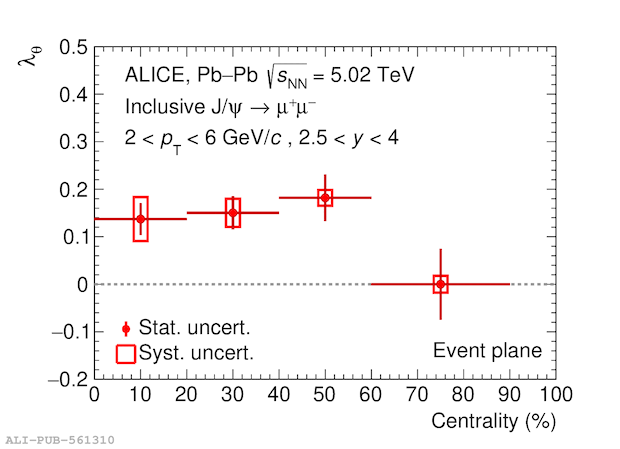
Centrality (left panel) and $p_{\rm T}$ dependence (right panel) of $\lambdaTheta$. The vertical bars represent the statistical uncertainties, while the boxes correspond to the systematic uncertainties. The horizontal bars show the size of the corresponding centrality and $p_{\rm T}$ ranges, with the data points being located at the center of each interval.
Detail description
Figure extracted from paper
