Energy
5.02 TeV
7 TeV
8 TeV
13 TeV
Figure Group
Figure Image

Figure image (.eps)
Figure image (.pdf)
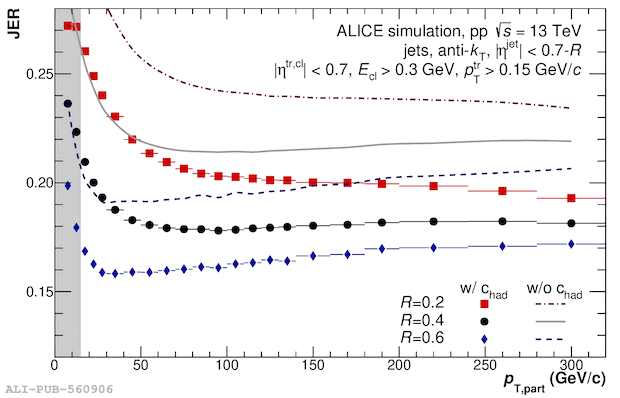
Figure Caption
Instrumental effects on the jet energy measurement at \sthirteen\ in \pp\ collisions as a function of the jet resolution parameter ($R=0.2$, $R=0.4$ and $R=0.6$) Upper panel: jet-by-jet distribution for various intervals in jet \pt. Lower panels: \gls{JES} as mean~(left) and \gls{JER} as standard deviation~(right) of these distributions with ($f=1$) and without ($f=0$) the hadronic correction~($c_{\rm had}$), shown as points and lines, respectively The gray bands indicate the \pT\ regions not taken into account for the final measurements.
Detail description
Figure extracted from paper
