Energy
5.02 TeV
7 TeV
8 TeV
13 TeV
Figure Group
Figure Image

Figure image (.eps)
Figure image (.pdf)
Figure Caption
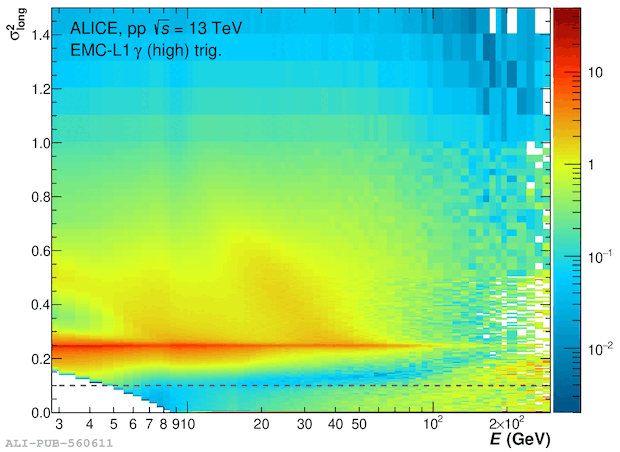
Left: $\shshlo$ as a function of the cluster energy. Data, pp collisions at \sthirteen\ triggered by the \gls{EMCal} and \gls{DCal} with \gls{L1}-$\gamma$ at $8.5$~GeV, V2 clusterizer Right: Number of cells in the cluster in the same T-Card as the highest energy cell as a function of the number of cells in a different T-Card, for clusters between 100 and 200~GeV.
Detail description
Figure extracted from paper
