Scope: PWG
PWG-CF (Flow and Correlations)
Energy
5.02 TeV
System
Pb-Pb
Figure Group
Figure Image
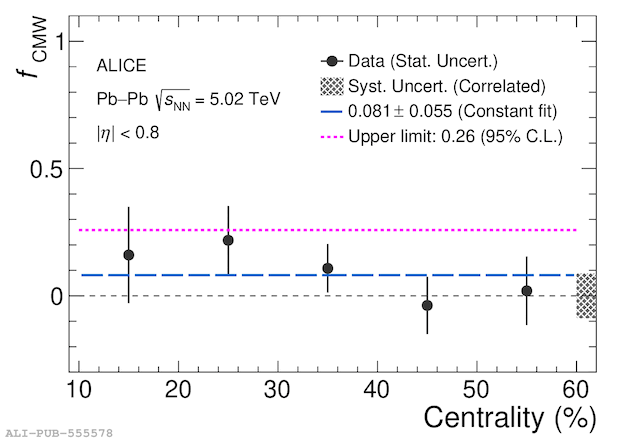
Figure image (.eps)
Figure image (.pdf)
Figure Caption
Centrality dependence of the extracted CMW fraction. The 95\% confidence level of the upper limit is also shown by the dotted magenta line. Statistical uncertainties are depicted by bars, while the correlated systematic uncertainty is represented by a shaded band on the right edge. The blue line is the constant fit line of the data points points.
Detail description
Figure extracted from paper