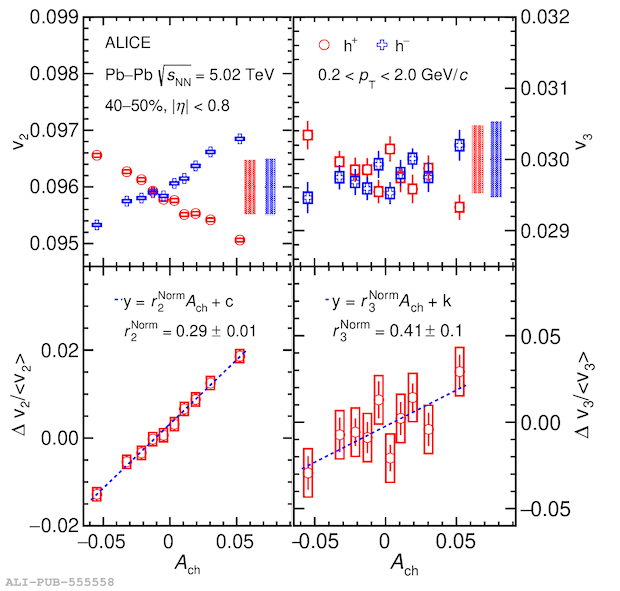
The top left panel shows the \vtwo\space of positively (red markers) and negatively (blue markers) charged hadrons as a function of the corrected \Ach\space, while the top right panel shows the same for \vthree. Statistical uncertainties are shown by bars and uncorrelated (correlated) systematic uncertainties by open boxes (shaded bands). The bottom left panel shows $\Delta v_{2}/\langle v_{2} \rangle $ as a function of the corrected \Ach\xspace and bottom right panel shows the same for $\Delta v_{3}/\langle v_{3} \rangle $, all for the 40--50\% centrality interval in Pb$-$Pb collisions at \snn = 5.02 TeV. The dotted blue line shows the linear fit to the data points to obtain the values of normalized slopes (\rnormvtwo\xspace and \rnormvthree).
Figure extracted from paper
