Scope: PWG
PWG-MM (Monte Carlo generators and Minimum Bias)
Energy
13 TeV
System
p-p
Figure Image

Figure image (.eps)
Figure Caption
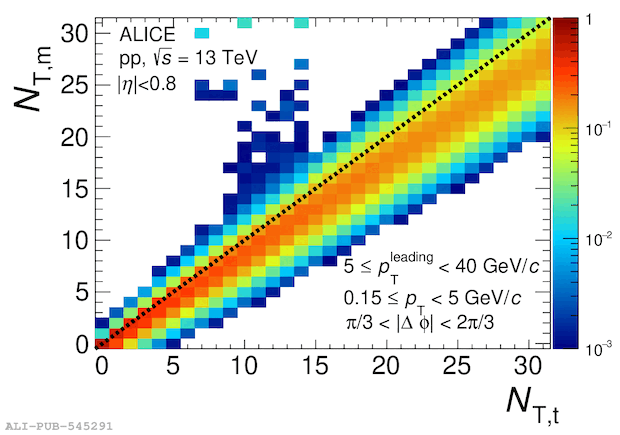
(Left) Correlation between the true \NTt and the measured \NTm multiplicity in the transverse region. (Right) Unfolding matrix \Mone. The iteration step of the unfolding matrix corresponds to the third.
Detail description
Figure extracted from paper
