Scope: PWG
PWG-LF (Light Flavour Spectra)
Energy
5.02 TeV
System
Pb-Pb
Figure Image
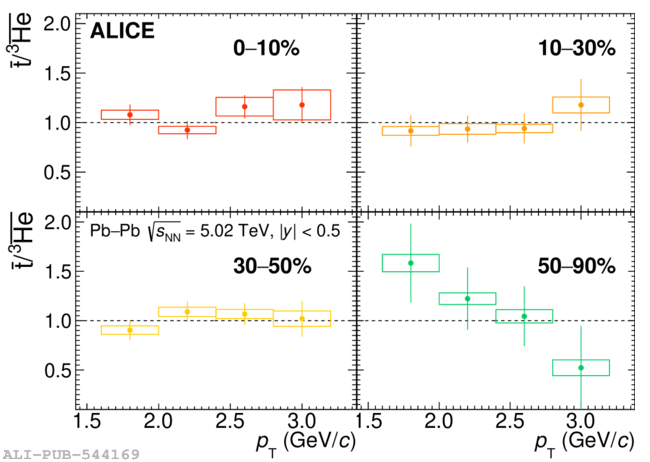
Figure image (.eps)
Figure image (.pdf)
Figure Caption
Left: ratios of transverse momentum spectra of \antiHH and \antiHee in different centrality intervals. Right: multiplicity dependence of the average \antiHH/\antiHee ratio compared with the coalescence model expectations (two-body coalescence in orange and three-body coalescence in blue)~. The open boxes represent the total systematic uncertainties, while the vertical lines are the statistical ones.
Detail description
Figure extracted from paper