Scope: PWG
PWG-LF (Light Flavour Spectra)
Energy
5.02 TeV
System
Pb-Pb
Figure Group
Figure Image
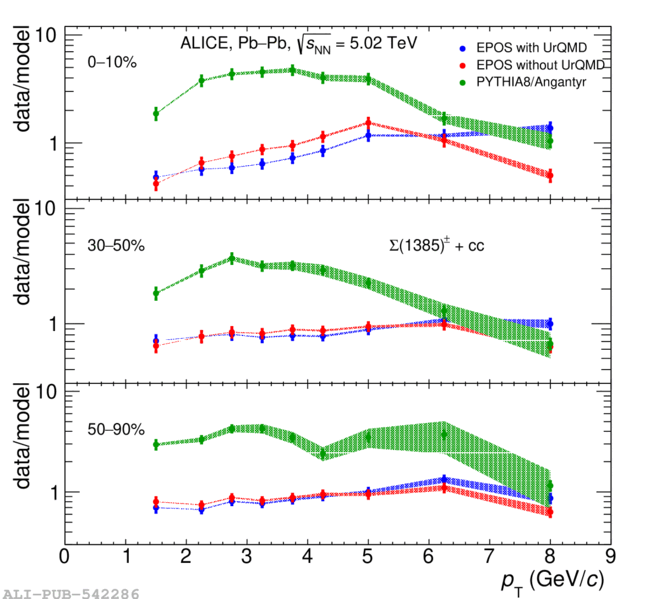
Figure image (.eps)
Figure image (.pdf)
Figure Caption
Ratio of the measured \pt distributions of summed $\Sigma(1385)^{\pm}$ to model predictions from \Angantyr (green) and EPOS with (blue) and without (red) the UrQMD afterburner. Each panel corresponds to one of the three centrality classes in \PbPb collisions at \fivenn. Shaded bands represent the model statistical uncertainty, while bars correspond to the data total uncertainties.
Detail description
Figure extracted from paper