Scope: PWG
PWG-LF (Light Flavour Spectra)
Energy
13 TeV
System
p-p
Figure Image

Figure image (.eps)
Figure Caption
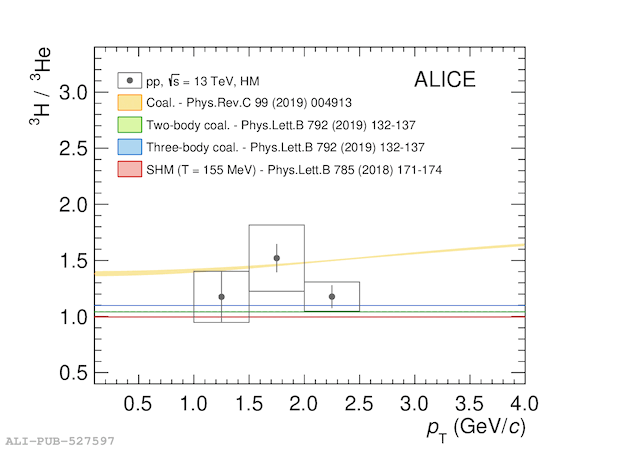
Ratio between the \pt spectra of triton and helion for the HM data sample. Vertical bars and boxes represent statistical and systematic uncertainties, respectively. The measurements are compared with the prediction of thermal (red) and coalescence models from Ref.~ (yellow) and Ref.~ (green and blue).
Detail description
Figure extracted from paper
