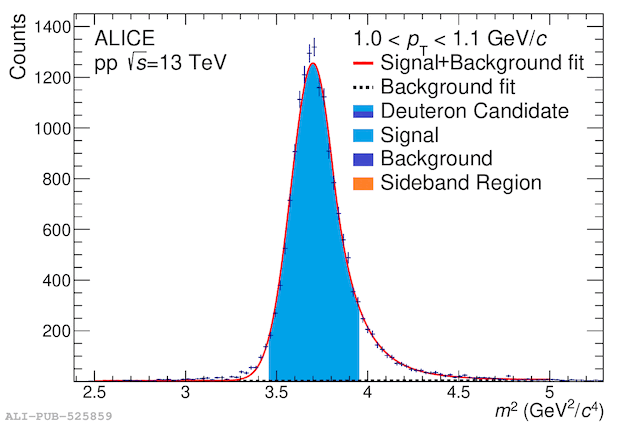
1.0 \pt~ 1.1 GeV/$c$ interval. 2.2 \pt~ 2.4 GeV/$c$ interval. 3.6 \pt~ 4.0 GeV/$c$ interval. Example $m^2$-distributions for a)~low, b)~intermediate and c)~high \pt\ intervals The signal plus background fit is shown as a solid~(red) line, and the extracted background as a dotted~(black) line The $\pm2$~standard deviation candidate region around the mean from the fit is shown in blue. In~(a) no sideband region is visible as the purity is essentially unity. In~(b) and c) the sideband regions are the shaded~(orange) areas between \todo{3--5} standard deviations on both sides of the peak. In the candidate region, the signal is depicted in light blue, while the background is shown in dark blue The purity in the candidate region is approximately 100\% in~(a), 60\% in~(b) and 25\% in~(c)..
Figure extracted from paper