Scope: PWG
PWG-CF (Flow and Correlations)
Energy
13 TeV
System
p-p
Figure Image

Figure image (.eps)
Figure image (.pdf)
Figure Caption
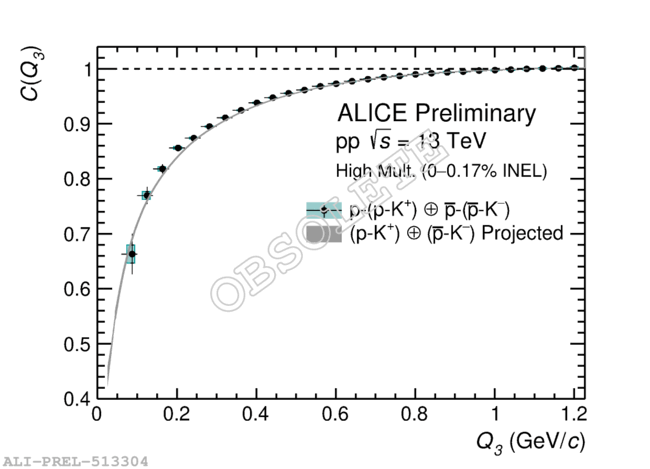
(p-K$^{+}$)-p correlation function obtained using the data-driven approach (data points) and the projector method (grey band). The error bars and the cyan boxes represent the statistical and systematic uncertainties, respectively. The grey band includes the statistical and systematic uncertainties summed in quadrature.
Detail description
Run HM pp 13 TeV data
ANA NOTE: https://alice-notes.web.cern.ch/node/1256
