Scope: PWG
PWG-LF (Light Flavour Spectra)
Energy
5.02 TeV
System
Pb-Pb
Figure Group
Figure Image

Figure image (.eps)
Figure image (.pdf)
Figure Caption
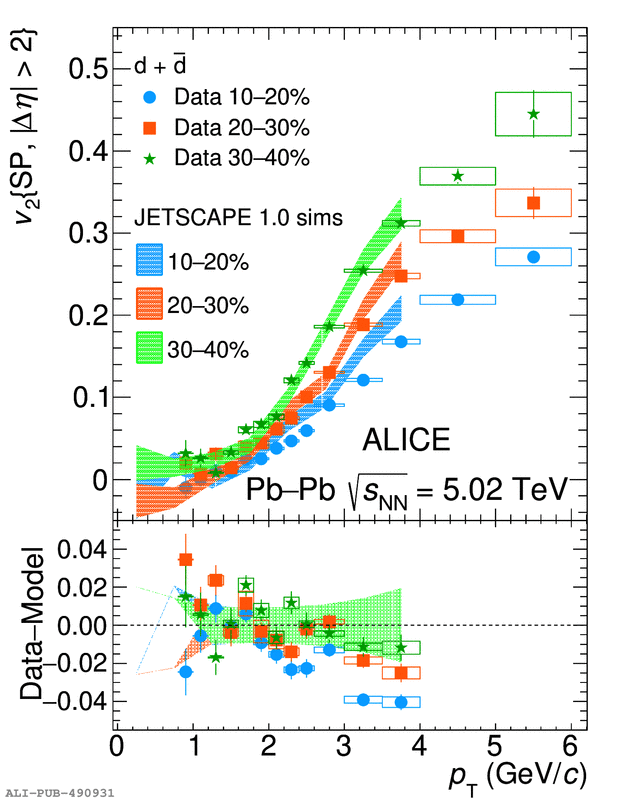
Measured deuterons \vtwo\ compared to the predictions from a microscopic model~ based on the JETSCAPE generator~. The model predictions, based on SMASH afterburner and which used TRENTo~ initial conditions, are shown as bands. The width of the band represents the statistical uncertainty associated with the model. In the lower panel the data-to-model differences are shown. Vertical bars and boxes represent the statistical and systematic uncertainties, respectively.
Detail description
Figure extracted from paper
