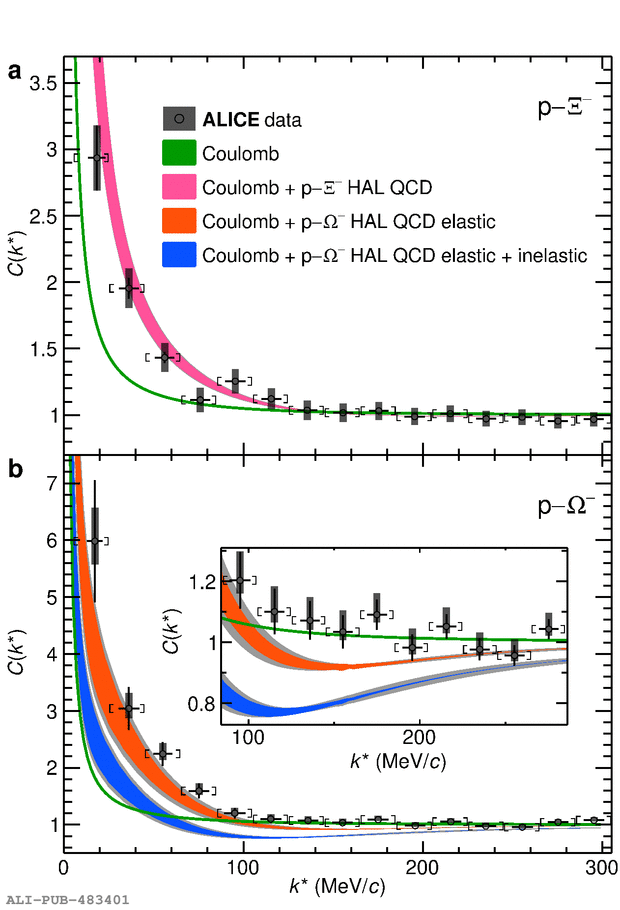
Experimental \pXim and \pOm correlation functions. a, b, Measured \pXim (a) and \pOm (b) correlation functions in high multiplicity \pp collisions at $\sqrt{s}=13$~TeV\xspace The experimental data are shown as black symbols The black vertical bars and the grey boxes represent the statistical and systematic uncertainties The square brackets show the bin width and the horizontal black lines represent the statistical uncertainty in the determination of the mean \ks for each bin The measurements are compared with theoretical predictions, shown as coloured bands, that assume either Coulomb or Coulomb + strong \HALQCD interactions For the \pOm system the orange band represents the prediction considering only the elastic contributions and the blue band represents the prediction considering both elastic and inelastic contributions The width of the curves including \HALQCD predictions represents the uncertainty associated with the calculation (see \nameref{sec:Methods} section 'Corrections of the correlation function' for details) and the grey shaded band represents, in addition, the uncertainties associated with the determination of the source radius The width of the Coulomb curves represents only the uncertainty associated with the source radius The considered radius values are \radiuspXi \si{\fm} for \pXim and \radiuspOmega \si{\fm} for \pOm pairs, respectively. The inset in b shows an expanded view of the \pOm correlationfunction for C(\ks) close to unity For more details see text
Figure extracted from paper