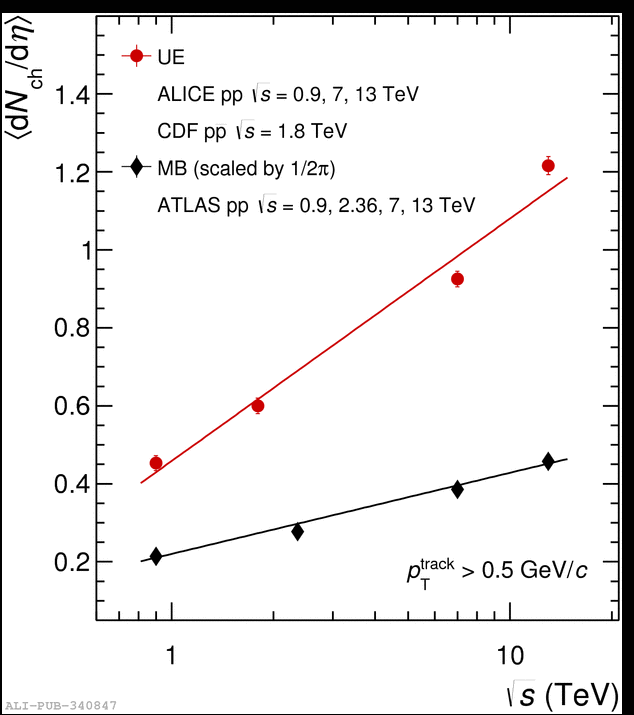
Fig.7: Comparison of number density in the plateau of the Transverse region with lower energy data taken from~\cite{cdf1, A51_ALICE_UE} and $dN_{\rm ch}/d\eta$ in minimum-bias events (scaled by $1/2\pi$)~\cite{atlasdndeta}. Both are for charged-particles with $\pt >$ 0.5~\gmom. Error bars represent statistical and systematic uncertainties summed in quadrature. The straight lines show the results of fitting data points with the functional form $a+b\ln{s}$.
Fig.7: Comparison of number density in the plateau of the Transverse region with lower energy data taken from~\cite{cdf1, A51_ALICE_UE} and $dN_{\rm ch}/d\eta$ in minimum-bias events (scaled by $1/2\pi$)~\cite{atlasdndeta}. Both are for charged-particles with $\pt >$ 0.5~\gmom. Error bars represent statistical and systematic uncertainties summed in quadrature. The straight lines show the results of fitting data points with the functional form $a+b\ln{s}$.
