Scope: PWG
PWG-MM (Monte Carlo generators and Minimum Bias)
Energy
13 TeV
System
p-p
Figure Image

Figure image (.eps)
Figure image (.pdf)
Figure Caption
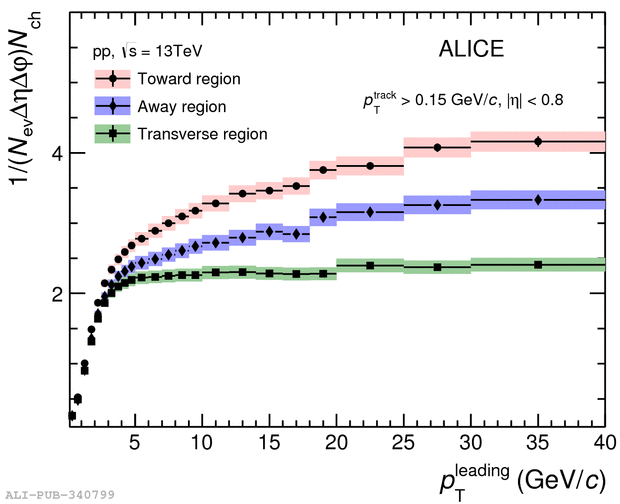
Fig.3: Number density $\Nch$ (left) and $\sum \pt$ (right) distributions as a function of \ptlead\ in Toward, Transverse, and Away regions for $\ptmin > 0.15 \; \gmom $. The shaded areas represent the systematic uncertainties and vertical error bars indicate statistical uncertainties.
Detail description
Fig.3: Number density $\Nch$ (left) and $\sum \pt$ (right) distributions as a function of \ptlead\ in Toward, Transverse, and Away regions for $\ptmin > 0.15 \; \gmom $. The shaded areas represent the systematic uncertainties and vertical error bars indicate statistical uncertainties.
