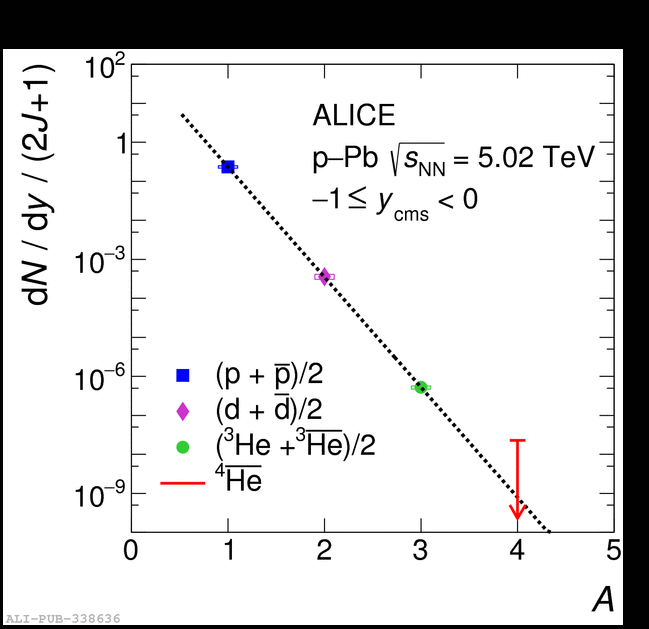
Figure 11b: The production yield \dNdy corrected for the spin degeneracy factor $(2J +1)$ as a function of the mass number for minimum-bias p--Pb collisions at $\sqrt{s_{\mathrm{NN}}}~=~5.02$ TeV is shown. The empty boxes represent the total systematic uncertainty while the statistical uncertainties are shown by the vertical bars. The line represents a fit with an exponential function.
Figure 11b: The production yield \dNdy corrected for the spin degeneracy factor $(2J +1)$ as a function of the mass number for minimum-bias p--Pb collisions at $\sqrt{s_{\mathrm{NN}}}~=~5.02$ TeV is shown. The empty boxes represent the total systematic uncertainty while the statistical uncertainties are shown by the vertical bars. The line represents a fit with an exponential function.
Data sample: LHC16q_pass1_FAST, LHC16q_pass1_CENT_woSDD
