Scope: PWG
PWG-CF (Flow and Correlations)
Energy
5.02 TeV
System
Pb-Pb
Figure Image
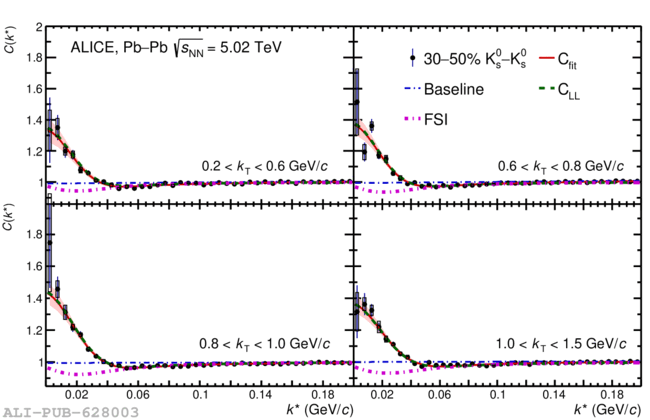
Figure image (.eps)
Figure image (.pdf)
Figure Caption
Correlation functions and their fits for the 30--50\% centrality range. Statistical errors are represented by bars and systematic errors by boxes. The individual contributions to the overall fit are shown as different lines with statistical uncertainty shown as the band around the fit.
Detail description
Figure extracted from paper