Scope: PWG
PWG-LF (Light Flavour Spectra)
Energy
5.36 TeV
System
Pb-Pb
Figure Group
Figure Image
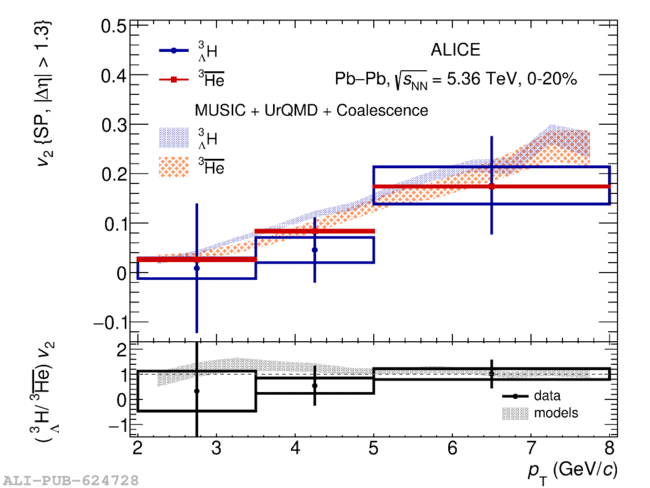
Figure image (.eps)
Figure image (.pdf)
Figure Caption
$v_2$ of $^3\overline{\mathrm{He}}$ (red markers) and hypertriton (blue markers) as a function of $p_{\mathrm T}$ for the 0-20\% (left panel) and 20-60\% (right panel) centrality intervals. Error bars represent statistical uncertainties, while boxes indicate systematic uncertainties, respectively. The data points are compared with the coalescence model expectations (see the text for details) for the two nuclear species.
Detail description
Figure extracted from paper