Energy
5.02 TeV
7 TeV
8 TeV
13 TeV
Figure Group
Figure Image

Figure image (.eps)
Figure image (.pdf)
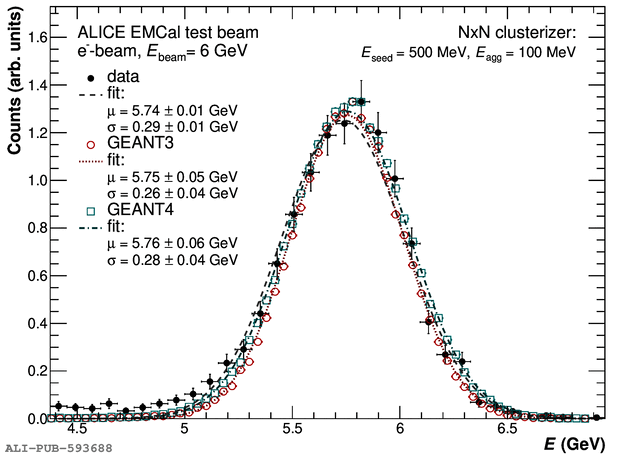
Figure Caption
Left: energy distribution of single cell clusters obtained from scans with a 6 GeV muon-beam. Right: energy distribution of clusters obtained from scans with a 6~GeV electron beam. For both cases the data are shown with black markers and compared with the predictions from \gls{MC} simulations with \gls{GEANT}3 and \gls{GEANT}4 transport codes.
Detail description
Figure extracted from paper
