Energy
5.02 TeV
7 TeV
8 TeV
13 TeV
Figure Group
Figure Image

Figure image (.eps)
Figure image (.pdf)
Figure Caption
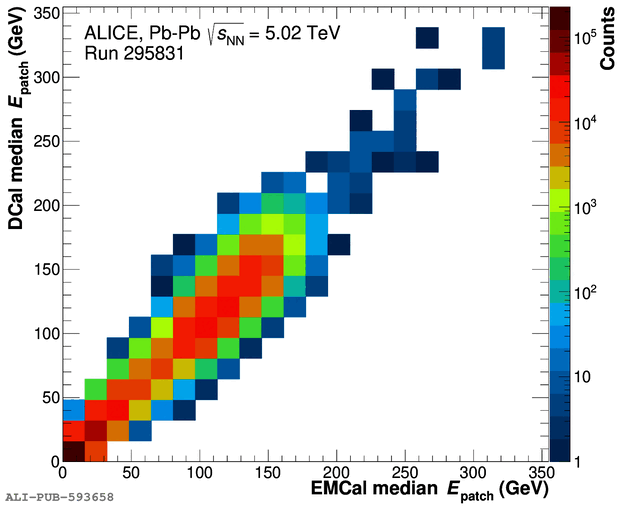
Comparison of \gls{EMCal} and \gls{DCal} median energies of the trigger patch from the online \gls{QA} on the \gls{HLT}. The linear correlation indicates that both subdetectors are measuring similar event activity.\.
Detail description
Figure extracted from paper
