Scope: PWG
PWG-CF (Flow and Correlations)
Energy
5.02 TeV
System
Pb-Pb
Figure Image

Figure image (.eps)
Figure image (.pdf)
Figure Caption
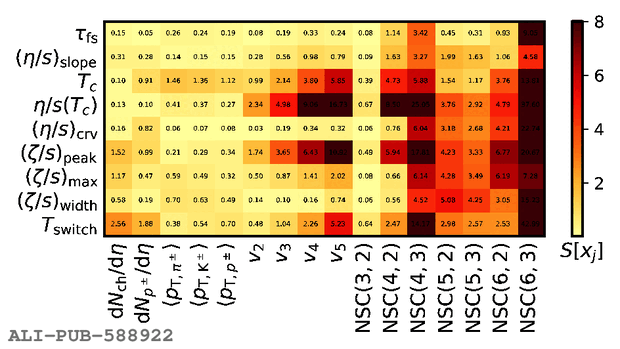
Sensitivity of the model parameters in Bayesian analysis to the flow observables, shown as a color map. Light yellow shades represent low or no sensitivity, whereas orange and red colors represent moderate or strong sensitivities to the corresponding model parameter variation, respectively. The sensitivity analysis is based on the {T\raisebox{-.5ex}{R}ENTo}+iEBE-VISHNU model~. Several key parameters are displayed, including $\eta/s(T)$, $\zeta/s(T)$, $\tau_{\rm fs}$, and $T_{\rm switch}$. More details can be found in Ref.~.
Detail description
Figure extracted from paper
