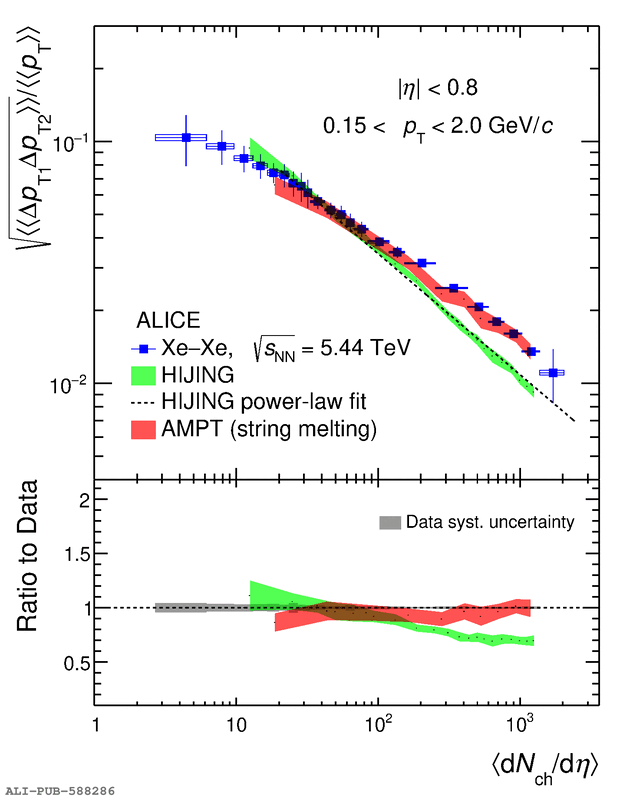
Upper panels: Comparisons of the evolution of the strength of $\sqrt{ \llangle \Delta p_{\rm T1}\Delta p_{\rm T2} \rrangle }/{\llangle p_{\rm T} \rrangle }$ with produced charged-particle multiplicity densities, $\langle {\rm d}N_{\rm ch}/{\rm d}\eta\rangle$, in \PbPb collisions at \snn = 5.02 TeV (left) and \XeXe collisions at \snn = 5.44 TeV (right) with calculations using the HIJING and AMPT models. Lower panels: Ratios of the model calculations to measured $\sqrt{ \llangle \Delta p_{\rm T1}\Delta p_{\rm T2} \rrangle }/{\llangle p_{\rm T} \rrangle }$ Solid symbols represent the measured data with statistical (vertical bars) and systematic (boxes) uncertainties. Model calculations are shown with shaded bands denoting their statistical uncertainty.
Figure extracted from paper