Scope: PWG
PWG-EM (Electromagnetic probes)
Energy
13 TeV
System
p-p
Figure Image

Figure image (.eps)
Figure image (.pdf)
Figure Caption
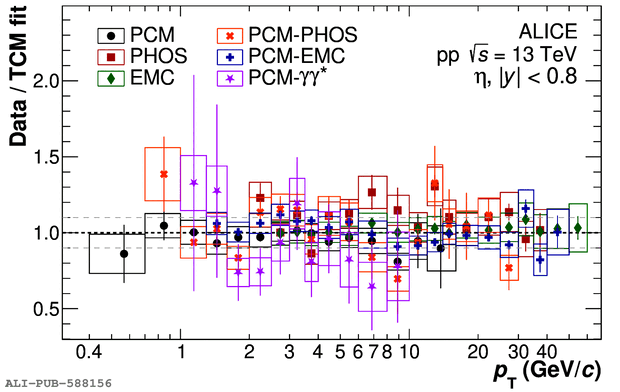
Ratio between each individual \piz (left) and \et (right) invariant differential cross section measurement, and the \ac{TCM} fit to the combined spectrum. The statistical uncertainties are represented as vertical error bars whereas the systematic uncertainties are shown as boxes.
Detail description
Figure extracted from paper
