Scope: PWG
PWG-LF (Light Flavour Spectra)
Energy
5.02 TeV
System
Pb-Pb
Figure Image

Figure image (.eps)
Figure image (.pdf)
Figure Caption
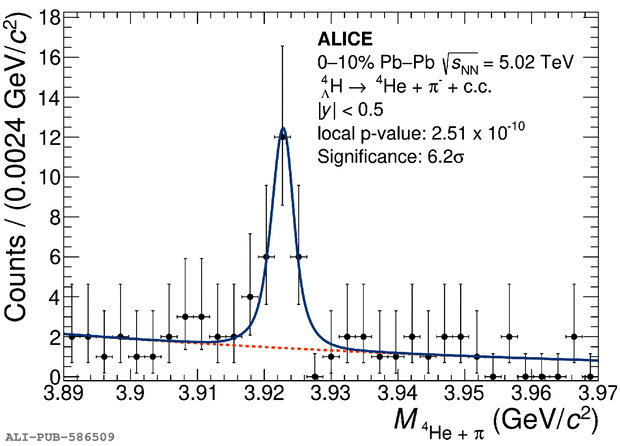
Invariant-mass spectra of (anti)\hyperE ~candidates on the left and of (anti)\hyper ~candidates on the right. Each spectrum shows the sum of the particle and antiparticle states and is fitted with a KDE template for the signal peak (blue curve) and an exponential function to model the background (orange curve).
