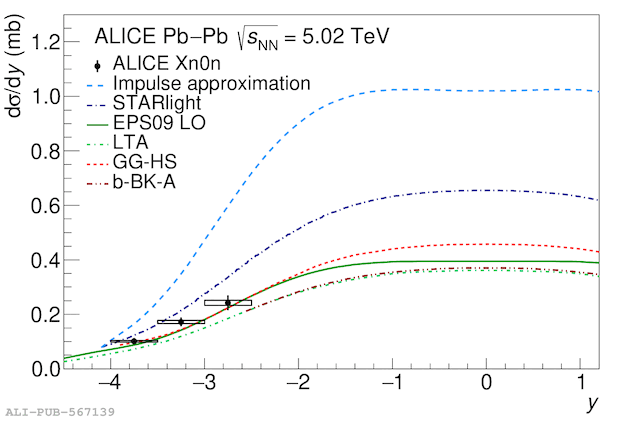
Measured cross section for the coherent production of $\Jpsi$ in UPCs at \fivenn. The solid markers represent the measured cross section (the measurement at $0.2\lvert y\rvert 0.8$ is shown at negative rapidities and reflected into positive rapidities with an open marker). The vertical line across a marker is the sum in quadrature of the statistical and uncorrelated systematic uncertainty. The width of the boxes depicts the range in rapidity covered by each measurement, while the height of a box is the sum in quadrature of the correlated systematic uncertainties and the effect of migrations across neutron classes. Note that the uncertainties from migrations are anti-correlated between the 0n0n and the other two neutron classes in each rapidity interval. The lines depict the prediction of the different models discussed in Sec.~???.
Figure extracted from paper
