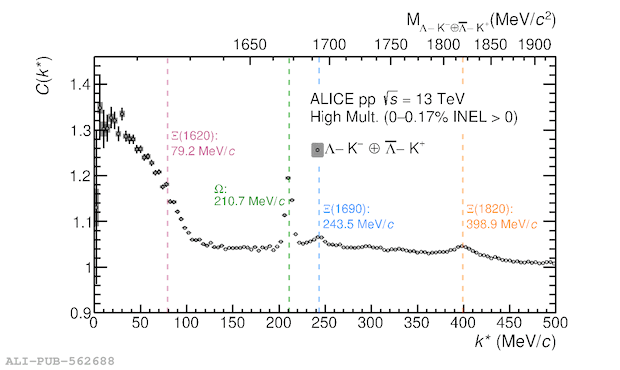
Upper: measured correlation function for \LKMin pairs (empty points) with statistical (line) and systematic (gray boxes) uncertainties. Lower: invariant mass spectrum of \LKMin pairs used to build the measured correlation function. Only the statistical uncertainties are shown. The upper x-axis indicates the energy at rest $E=\sqrt{(\kstar)^2+m_\lmb ^2}+\sqrt{(\kstar)^2+m_K ^2}$ of the pair written as a function of the relative momentum of the \LKMin pair. The quantity $E$ corresponds to the invariant mass $M$ of the \LKMin pairs. The colored vertical dashed lines indicate the values of the relative momentum \kstar (upper panel) and the value of the energy $E$ at rest of each resonance (lower panel) corresponding to its nominal mass extracted in the final femtoscopic fit.
Figure extracted from paper
