Scope: PWG
PWG-JE (Jets)
Energy
5.02 TeV
System
p-p
Figure Image

Figure image (.eps)
Figure image (.pdf)
Figure Caption
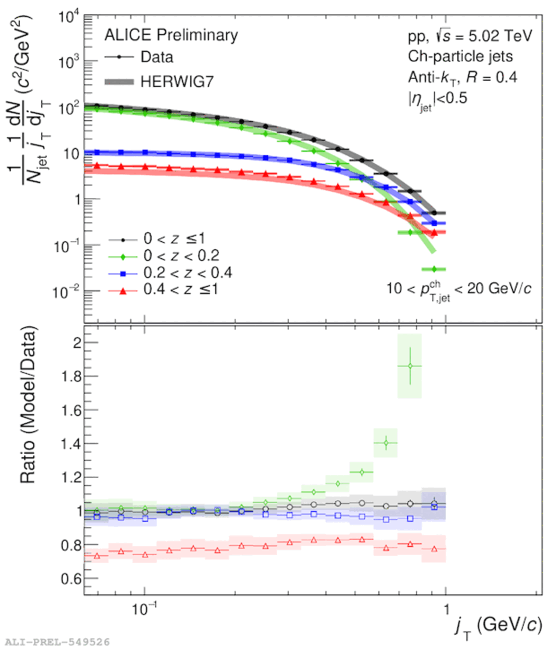
The upper panel shows the $j_\mathrm{T}$ distributions of charged particles n R = 0.4 anti-$k_\mathrm{T}$ charged-particle jets as measured with LHC 17p $pp$ collisions at $\sqrt{s}$ = 5.02 TeV and HERWIG7 MC generator in $10 < p_\mathrm{T,jet}^\mathrm{ch} < 20 \mathrm{GeV}/c$ in several $z$ ranges. The bottom panel shows ratios of $j_\mathrm{T}$ distributions of data with respect to the Herwig.
Detail description
This figure is the derived plot from the last preliminaries.
Markers indicate the data $j_\mathrm{T}$ distributions and the line shows the $j_\mathrm{T}$ distributions from MC model.
$z$ ranges of 0 < $z$ 0.2, 0.2 < $z$ < 0.4, 0.4 < $z \leq$ 1 are shown.
