Scope: PWG
PWG-JE (Jets)
Energy
13 TeV
System
Pb-Pb
Figure Group
Figure Image

Figure image (.eps)
Figure image (.pdf)
Figure Caption
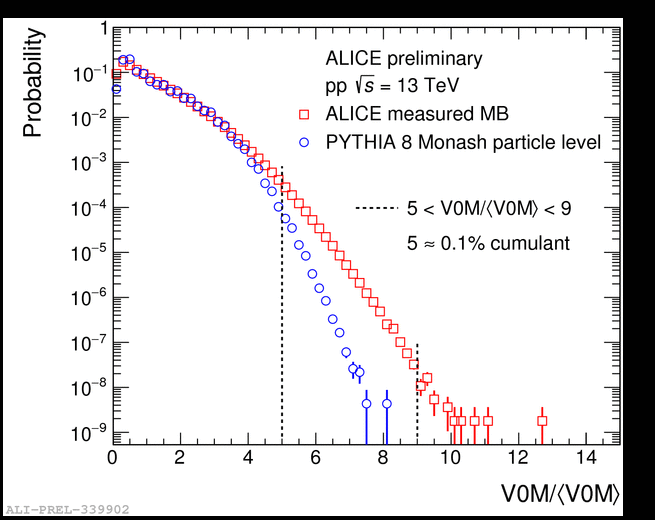
V0M/<V0M> distribution as measured by ALICE in minimum bias pp 13 TeV and as simulated by PYTHIA8 Monash on particle level. The vertcial dashed lines give the range of HM trigger.
Detail description
V0M/<V0M> distribution as measured by ALICE in minimum bias pp 13 TeV and as simulated by PYTHIA8 Monash on particle level. The vertcial dashed lines give the range of HM trigger.
