
Scope: PWG
PWG-EM (Electromagnetic probes)
Energy
5.36 TeV
9.61 TeV
13.6 TeV
System
O-O
p-O
p-p
Figure Group
Figure Image
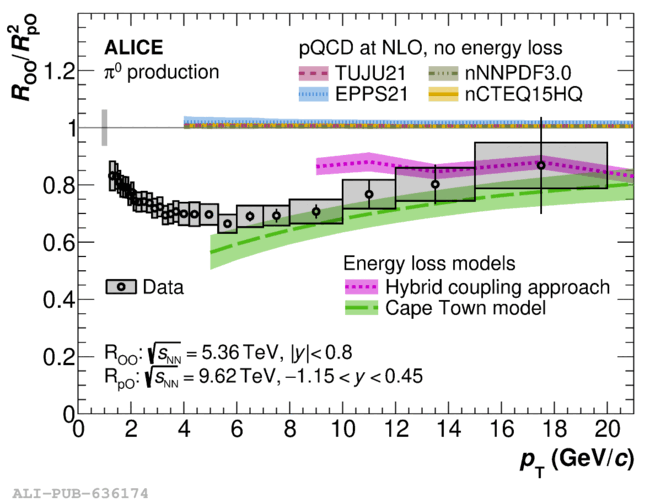
Figure image (.eps)
Figure image (.pdf)
Figure Caption
Double ratio \ROOpOpO compared to pQCD calculations including only CNM effects~, located around unity, and to energy loss models~, which exhibit a suppression similar to the one observed in data. Vertical bars (boxes) represent the statistical (systematic) uncertainty, while a box around unity denotes the normalization uncertainty due to the luminosity determination.
Detail description
Figure extracted from paper