Scope: PWG
PWG-LF (Light Flavour Spectra)
Energy
13 TeV
System
p-p
Figure Image
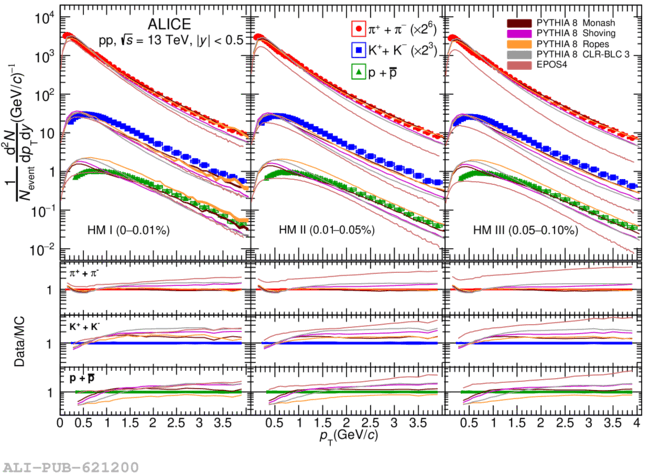
Figure image (.eps)
Figure image (.pdf)
Figure Caption
(Top panels) Measured $\pt$ spectra of $\pi$, K, and p compared with PYTHIA 8 Monash, PYTHIA~8~Shoving, PYTHIA~8~Ropes, PYTHIA~8~CLR-BLC~3, and EPOS4 MC predictions for HM I (left), HM II (middle), and HM III (right) multiplicity classes. Statistical (bars) and systematic (open boxes) uncertainties are shown for the data. The shaded bands around the MC curves represent the statistical uncertainties of the model predictions. (Bottom panels) Ratio of the data to MC predictions. The bands around one in the bottom panels represent the systematic uncertainties of the data. Model uncertainties are not included in the ratio plots for better visibility.
Detail description
Figure extracted from paper