
Scope: PWG
PWG-CF (Flow and Correlations)
Energy
5.02 TeV
System
Pb-Pb
Figure Image
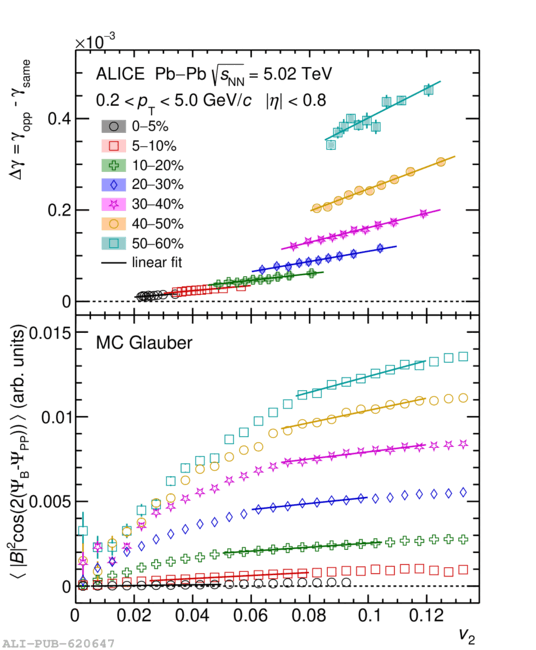
Figure image (.eps)
Figure image (.pdf)
Figure Caption
The dependence of $\Delta\gc$ (top) and of the expected CME signal from a MC Glauber simulation~ (bottom) on $v_2$ together with linear fits (solid lines) for various centrality intervals. For the model, no event shape selection is performed and the range of the fit is based on the $v_2$ variation observed in data within each centrality class. Statistical and systematic uncertainties are represented by vertical lines and shaded boxes, respectively.
Detail description
Figure extracted from paper