Scope: PWG
PWG-DQ (Dileptons and Quarkonia)
Energy
13 TeV
System
p-p
Figure Image

Figure image (.eps)
Figure image (.pdf)
Figure Caption
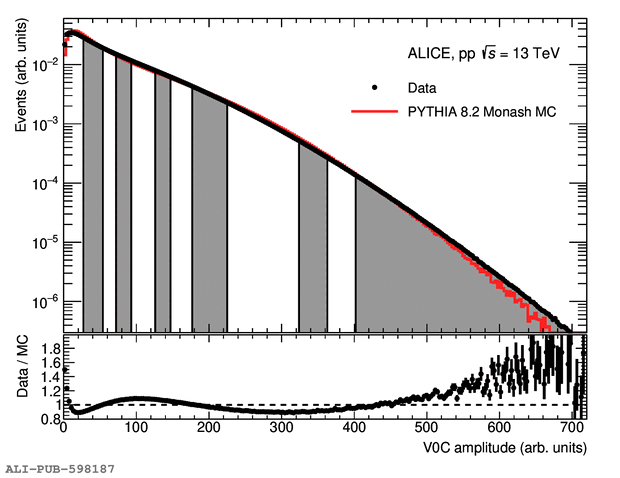
The V0C distributions in minimum-bias events in data and PYTHIA~8.2 Monash MC~. The chosen multiplicity classes are indicated by vertical lines. The percentile ranges corresponding to the multiplicity classes (from low to high multiplicities) are 70-100\%, 50-70\%, 40-50\%, 30-40\%, 20-30\%, 15-20\%, 10-15\%, 5-10\%, 1-5\%, 0.5-1\%, 0.25-0.5\%, 0-0.25\%. The bottom panel shows the ratio between data and MC.
Detail description
Figure extracted from paper
