Scope: PWG
PWG-CF (Flow and Correlations)
Energy
5.02 TeV
System
Pb-Pb
Figure Image

Figure image (.eps)
Figure image (.pdf)
Figure Caption
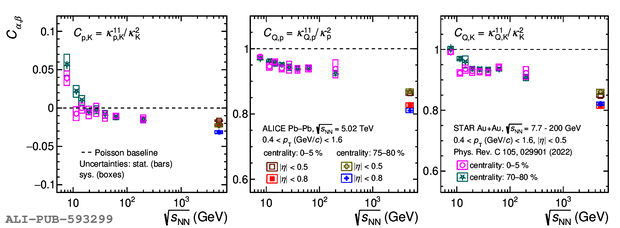
Energy dependence of $C_\mathrm{p,K}$ (left), $C_\mathrm{Q,p}$ (middle), and $C_\mathrm{Q,K}$ (right), with lower energy results corresponding to STAR experiment~. The statistical (systematic) uncertainties are represented by vertical bars (boxes) and the dashed line corresponds to Poisson baseline.
Detail description
Figure extracted from paper
