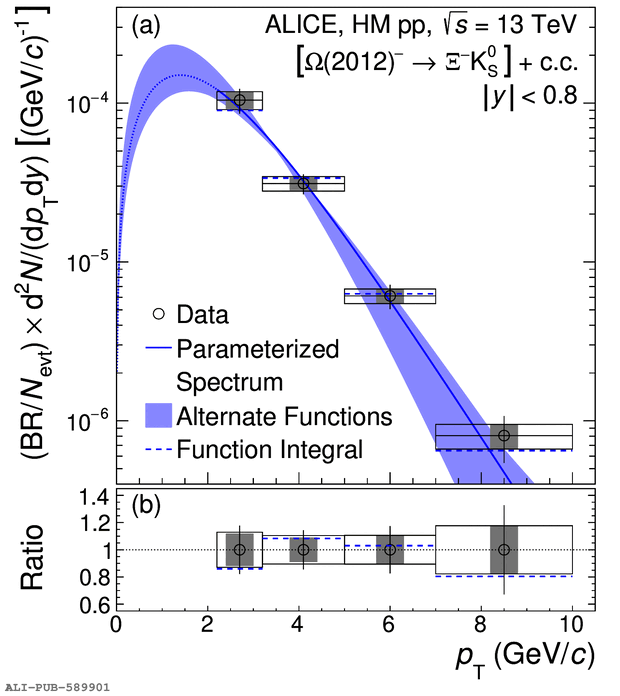
(a) \ptt spectrum of the \oms in HM pp collisions at \rs (not corrected for the unmeasured branching ratio BR for the studied decay channel). Vertical bars represent statistical uncertainties, empty boxes represent the total systematic uncertainties, and shaded boxes represent the portion of the systematic uncertainties that is uncorrelated between \ptt intervals (only slightly smaller than the total systematic uncertainties). The data points are plotted at the center of each \ptt interval and the horizontal bars and boxes span the entire width of each \ptt interval. The curve is the parameterized spectrum for the \oms baryon. The shaded band surrounding the curve indicates the region spanned by the envelope of alternate functions used to describe the spectrum, which affect the extrapolation of the yield to low \ptt. The horizontal dashed lines labeled ``Function Integral'' show the integral of the parameterized spectrum over each of the four measured \ptt intervals. (b) The horizontal dashed lines show the ratio of the parameterized yield to the measured \oms yield in each of the four \ptt intervals. The bars and boxes indicate the fractional uncertainties (statistical, total systematic, and \ptt-uncorrelated systematic) of the measured data.
Figure extracted from paper
