Scope: PWG
PWG-LF (Light Flavour Spectra)
Energy
13 TeV
System
p-p
Figure Group
Figure Image

Figure image (.eps)
Figure image (.pdf)
Figure Caption
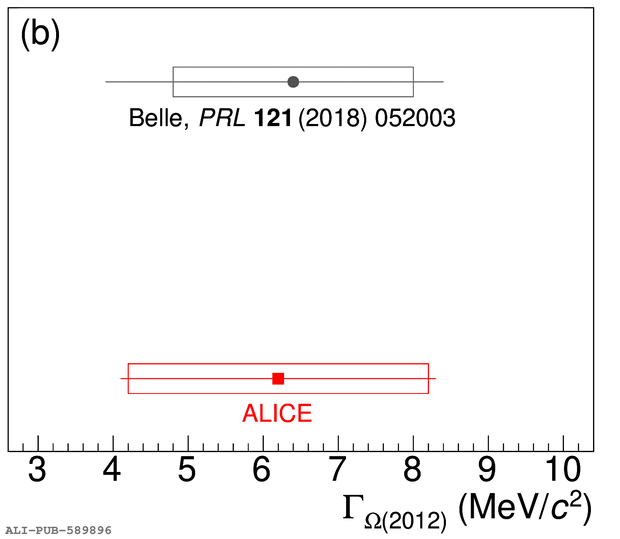
Comparison of mass (a) and width (b) measurements of the \oms. The plotted results are from Belle~ and ALICE (this work). Statistical uncertainties are shown as bars, and systematic uncertainties are shown as boxes.
Detail description
Figure extracted from paper
