Energy
2.76 TeV
5.02 TeV
7 TeV
8 TeV
13 TeV
System
p-p
Pb-Pb
p-Pb
Figure Group
Figure Image

Figure image (.eps)
Figure image (.pdf)
Figure Caption
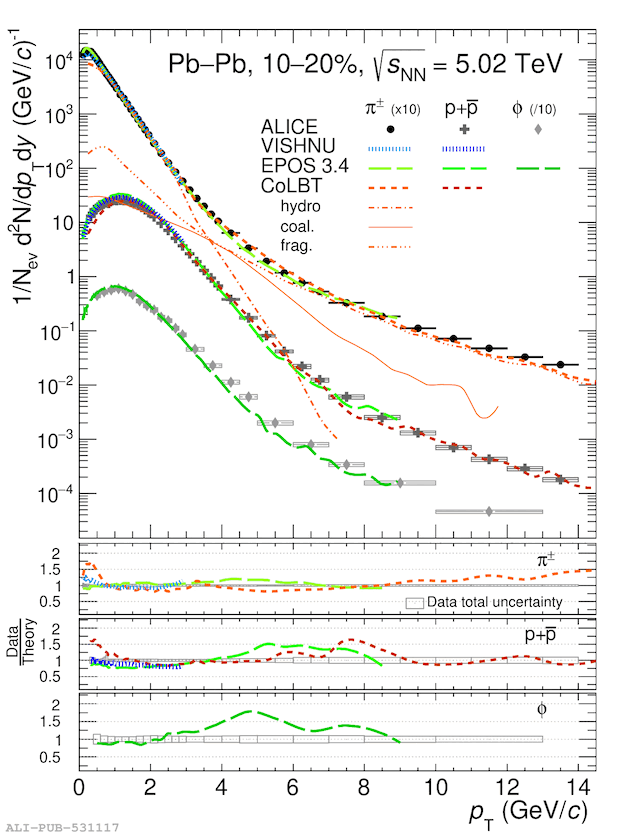
Comparison of \rmPiPM, p+\pbar~, and \rmPhiMes~ transverse-momentum spectra in 10--20\% central \PbPb\ collisions at \sqrtSnn~=~5.02~\tev\ to VISHNU~, EPOS v3.4~, and CoLBT~ models. The systematic uncertainties are represented as boxes while the statistical uncertainties are shown as vertical bars.
Detail description
Figure extracted from paper
