Scope: PWG
PWG-CF (Flow and Correlations)
Energy
13 TeV
System
p-p
Figure Image
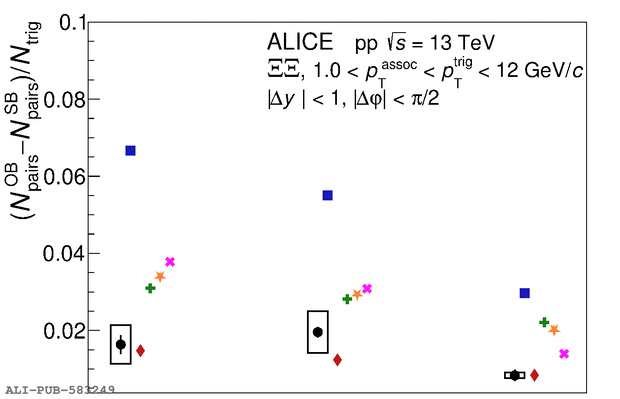
Figure image (.eps)
Figure image (.pdf)
Figure Caption
The integrated OB--SB near-side yields (top) and near-side RMS widths in $\Delta y$ (bottom) are shown for $\Xi\Xi$ correlations as a function of multiplicity. Statistical and systematic uncertainties are represented by bars and boxes, respectively. The ALICE data are compared with the following models: \pythia{} Monash tune (blue), \pythia{} with junctions enabled (green), \pythia{} with junctions and ropes (yellow), \eposlhc{} (red), and \herwig{} (pink). The statistical uncertainties on the model predictions, denoted by vertical bars, are smaller than the marker sizes in most cases.
Detail description
Figure extracted from paper